
ClickHouse handles analytics at scale: billions of events, sub-second aggregations. The OpenAI Codex CLI brings AI coding assistance to your terminal. With Sequel's MCP server connecting them, you can ask natural language questions about your ClickHouse data from within the same terminal session where you build and debug code.
What You'll Accomplish
Once set up, you can launch Codex and ask:
- "How many events were recorded in the last 24 hours?"
- "What's the most common error code in the past hour?"
- "Which user segments have the highest 7-day retention?"
Prerequisites
- A Sequel account -- Sign up free at sequel.sh
- A running ClickHouse instance -- ClickHouse Cloud or self-hosted
- OpenAI Codex CLI installed -- follow the install guide at openai.com/codex
Step 1: Connect Your ClickHouse Database to Sequel
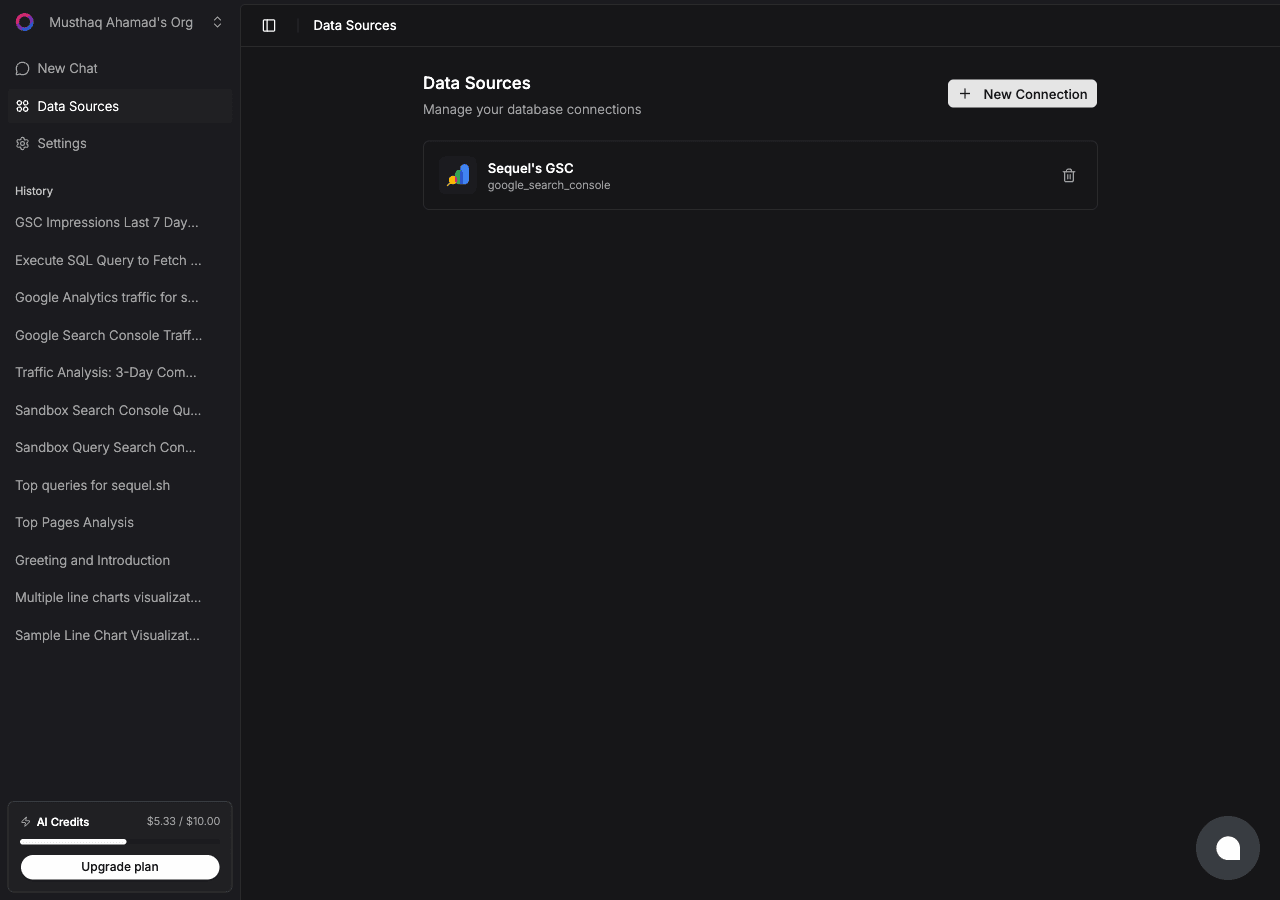
Sign in to sequel.sh and click Data Sources in the left sidebar.
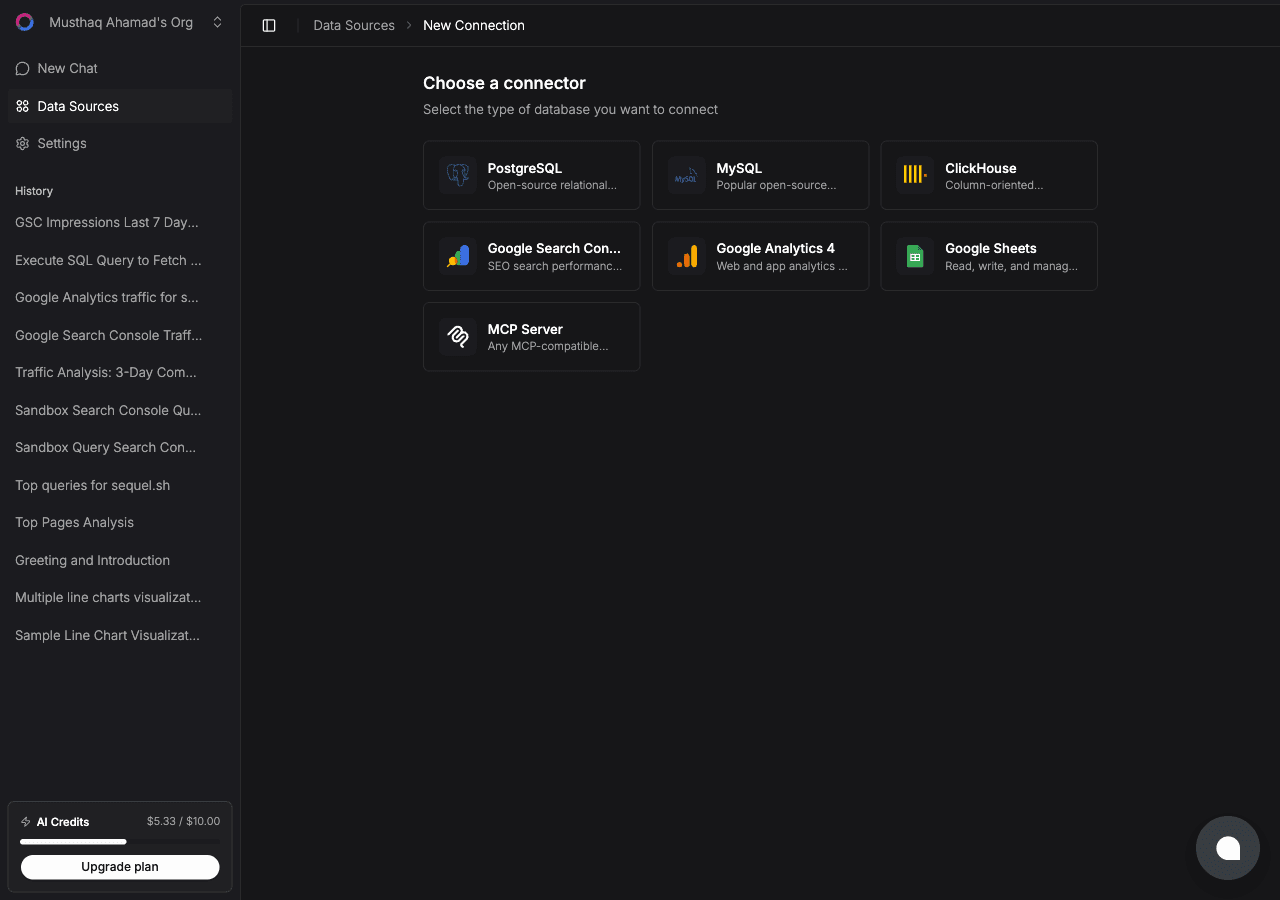
Click New Connection. On the "Choose a connector" page, select ClickHouse.
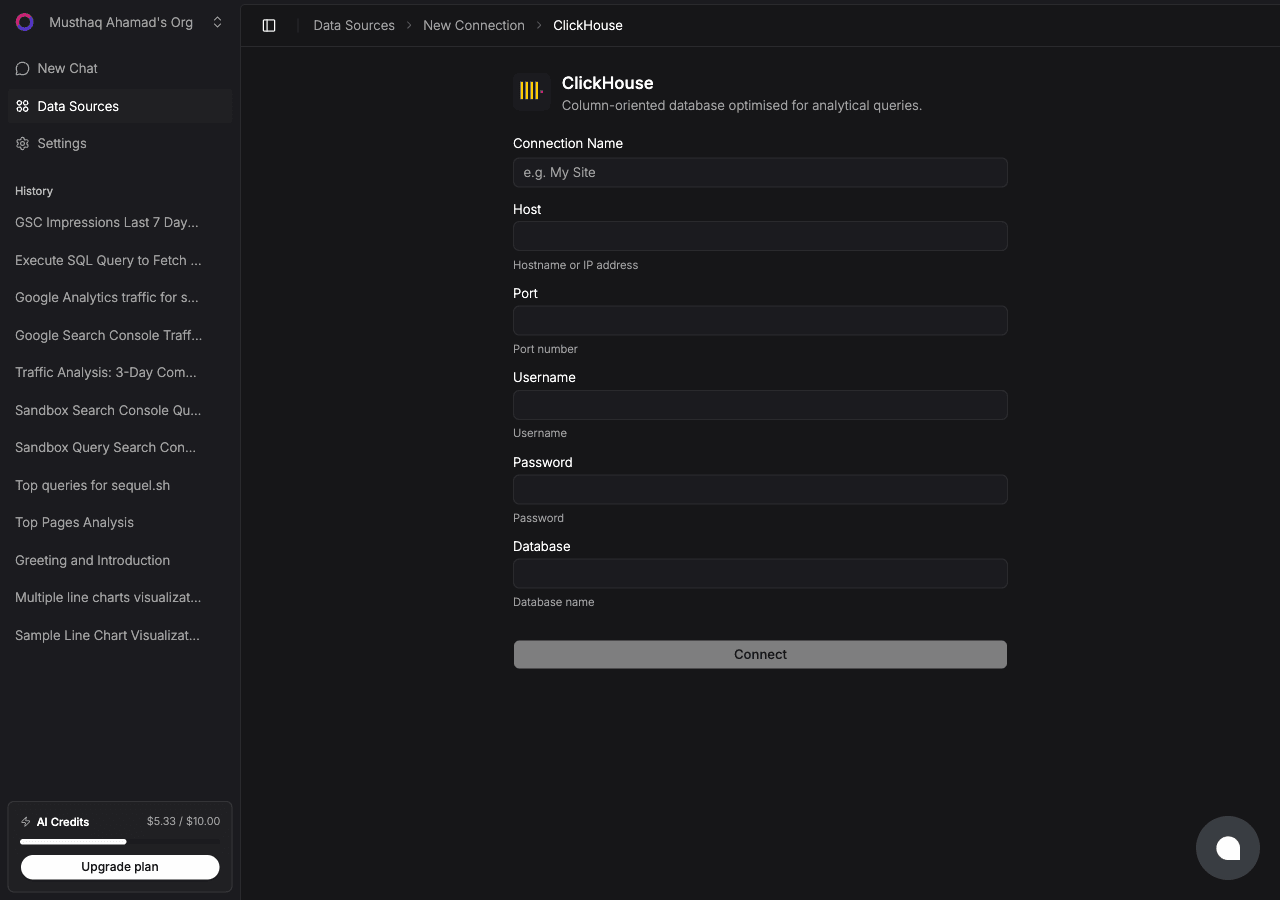
Fill in the connection fields:
- Connection Name -- a memorable label, e.g.
ClickHouse Prod - Host -- your ClickHouse hostname, without
https://orhttp:// - Port --
8443for ClickHouse Cloud,8123for self-hosted HTTP - Username -- e.g.
default - Password -- your ClickHouse password
- Database -- the database name to connect to
For ClickHouse Cloud, find these in your service dashboard under Connect -> HTTPS interface.
Click Connect to verify and save.
Step 2: Get Your Sequel API Key
Click Settings in the left sidebar, then select API Keys from the settings navigation.
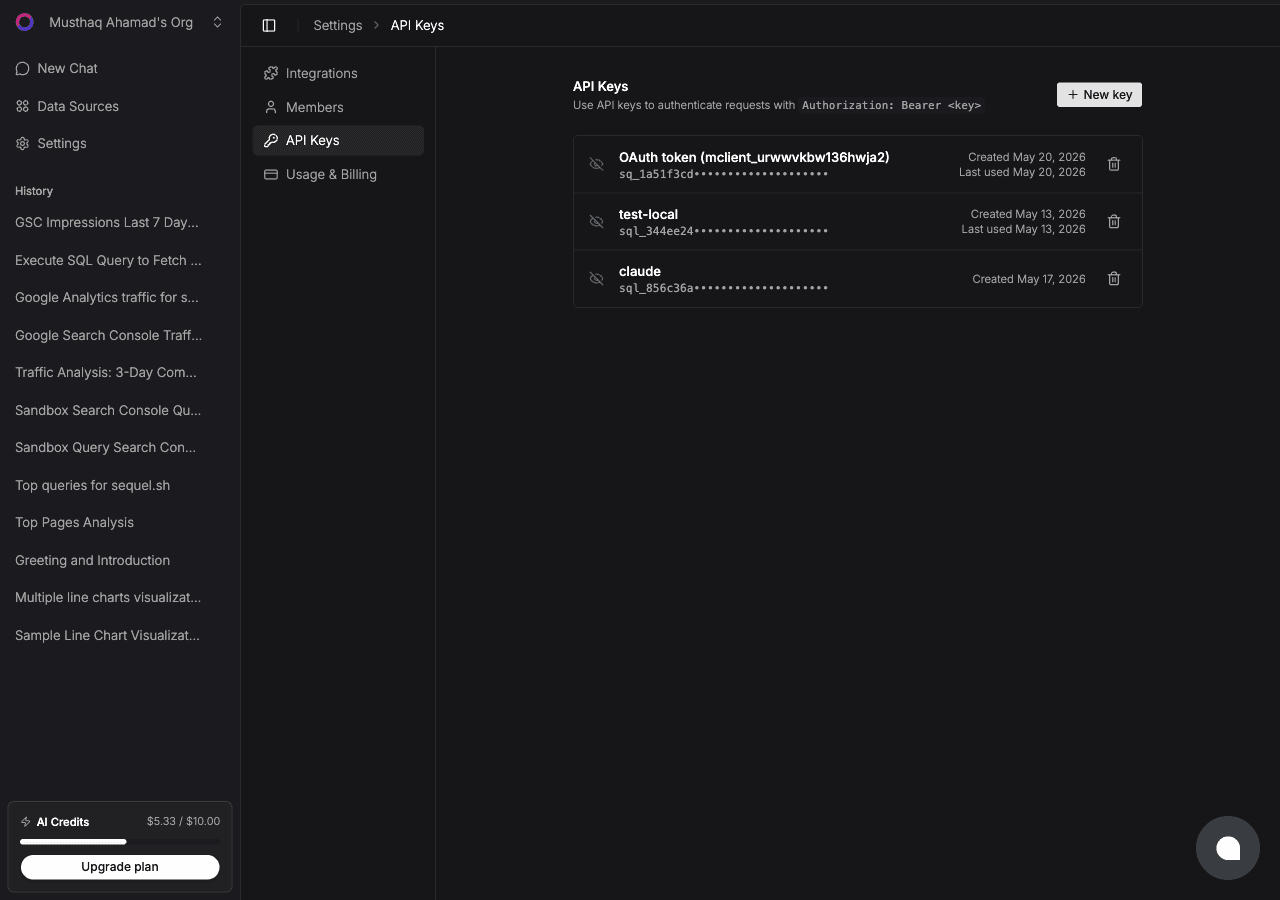
Click New key, name it codex, and copy the key (starts with sql_).
Step 3: Configure Codex CLI to Use Sequel MCP
Set your API key as an environment variable -- add to ~/.zshrc or ~/.bashrc:
export SEQUEL_API_KEY="sql_your_api_key"Reload your shell:
source ~/.zshrcAdd Sequel to ~/.codex/config.toml -- create the file if it doesn't exist:
[mcp_servers.sequel]
url = "https://api.sequel.sh/mcp"
bearer_token_env_var = "SEQUEL_API_KEY"
Save the file. The next Codex session will load the Sequel MCP server automatically.
Step 4: Query Your ClickHouse Database
codexThen ask:
What tables are in the ClickHouse database?
How many events per event_type were tracked yesterday?
Show me the hourly breakdown of API request counts for today.
What You Can Do Now
- Query data while coding -- ask "What do the most recent 10 rows in the events table look like?" without leaving your terminal
- Debug analytics pipelines -- ask "Are there any event types with zero records in the past hour?" to spot ingestion gaps
- Validate data after deployments -- ask "Are new events being tracked after the latest release?"
- Build analytics features -- describe the metrics you need, then ask Codex to write the ClickHouse query grounded in your actual schema
- Benchmark before optimizing -- ask "How many rows does this table have?" before writing query optimization code