13 Best Data Visualization Tools For Businesses in 2024

As businesses generate more data every day, turning that data into meaningful insights becomes increasingly important. Whether it’s tracking performance, understanding customer behavior, or identifying key trends, data visualization is a powerful tool to help make sense of it all.
But choosing the right data visualization tool isn’t always straightforward. Many traditional platforms are complex, require expert-level knowledge, and can take hours or even days to set up. The process often involves steep learning curves, creating bottlenecks for teams that need quick, easy access to insights.
This blog will explore the top data visualization tools available today, their strengths, and their limitations, helping you navigate the choices to find the right fit for your needs. Let’s dive in.
What Is Data Visualization?
Data visualization is the technique of transforming raw data into visual formats like charts, geographic maps, infographics, sparklines, heat maps, and statistical graphs. By presenting data visually, complex information becomes much easier to understand, making patterns, trends, and insights more accessible and actionable.
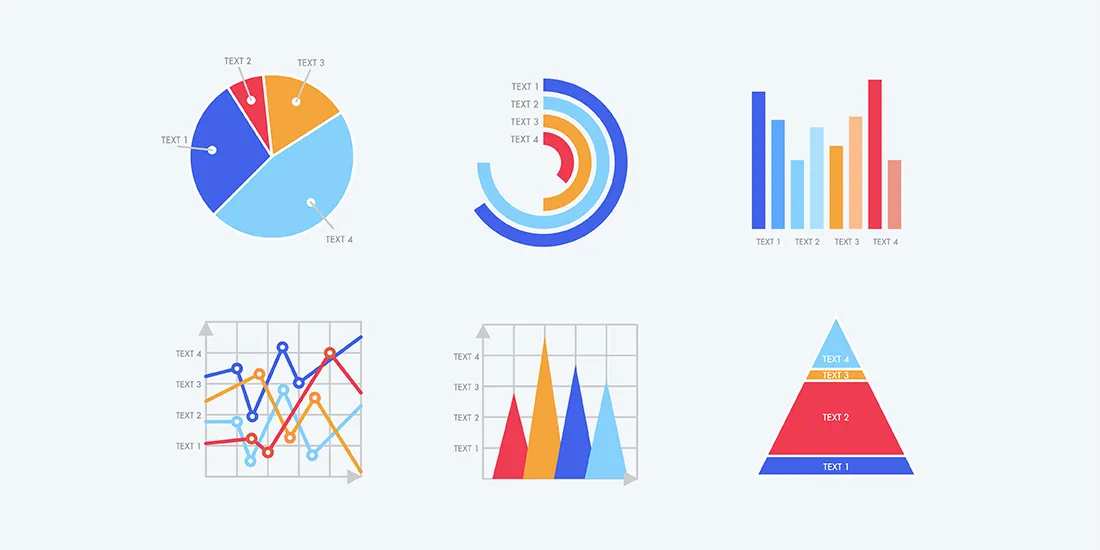 Source: Beautiful.ai
The visual representation of data not only simplifies analysis but also helps stakeholders make informed, real-time decisions. This process is particularly valuable in business environments, where quick and efficient decision-making is essential for success.
Modern data visualization tools offer more than just static graphs—they support advanced features like streaming data integration, AI-powered insights, embeddability, and interactive exploration. These tools empower teams to collaborate and explore data in real-time, often without needing a data specialist. Additionally, self-service capabilities allow users to interact directly with data, enhancing flexibility and reducing reliance on technical expertise.
What Are Data Visualization Tools?
Data visualization tools are software applications designed to help users convert raw data into visual formats like charts, graphs, maps, and dashboards. These tools simplify the process of analyzing complex datasets, making it easier to identify trends, patterns, and actionable insights. Some of the best data visualization tools available today include Sequel, Google Charts, Tableau, Grafana, FusionCharts, Datawrapper, Infogram, ChartBlocks, etc.
Each tool offers varying degrees of functionality, from simple, easy-to-use interfaces to advanced features capable of handling large datasets.
As data becomes increasingly critical for decision-making in organizations, the demand for intuitive and efficient data visualization tools is growing. These tools enable users to transform data into meaningful visuals without needing extensive technical expertise. While many tools offer pre-built templates for basic visualizations, their capabilities vary widely, especially when it comes to managing larger, more complex data sets.
The Best Data Visualization Tools in 2024
Let’s take a look at these data visualization tools in detail. We’ll cover their key features, pros, and cons. This will help you evaluate their use cases effectively.
1. Power BI

Power BI is Microsoft's flagship data visualization tool, designed for both cloud deployment and on-premises use. It is ideal for users looking to leverage a comprehensive, easy-to-use interface for real-time insights and visualizations. One of the key advantages of Power BI is its seamless integration with other Microsoft tools like Excel, Azure, and SQL Server, making it an excellent choice for businesses already using the Microsoft ecosystem. Power BI offers customizable dashboards, real-time analytics, and strong security features.
Pros:
- Integrates seamlessly with existing Microsoft products
- Allows non-technical users to create dashboards
- Real-time insights and robust security features
- Does not require specialized tech support
Cons:
- Limited when working with multiple, diverse datasets
- Some advanced customization may require additional expertise
2. Tableau

Tableau is one of the most well-known data visualization tools, valued for its powerful capabilities and ease of use. Owned by Salesforce, Tableau offers a range of products including desktop, server, and web-based solutions. Its ability to connect to numerous data sources, from spreadsheets to complex databases like Hadoop and AWS, makes it a go-to for enterprise-level solutions. Tableau excels in creating highly interactive and visually appealing charts, dashboards, and maps, making it ideal for anyone from beginner data enthusiasts to seasoned analysts.
Pros:
- Industry-leading visualization options
- Easy to use for both beginners and professionals
- Supports a wide range of data sources
- Active community and extensive resources
Cons:
- Expensive licensing fees
- Lacks auto-refresh and scheduling for reports
3. QlikView
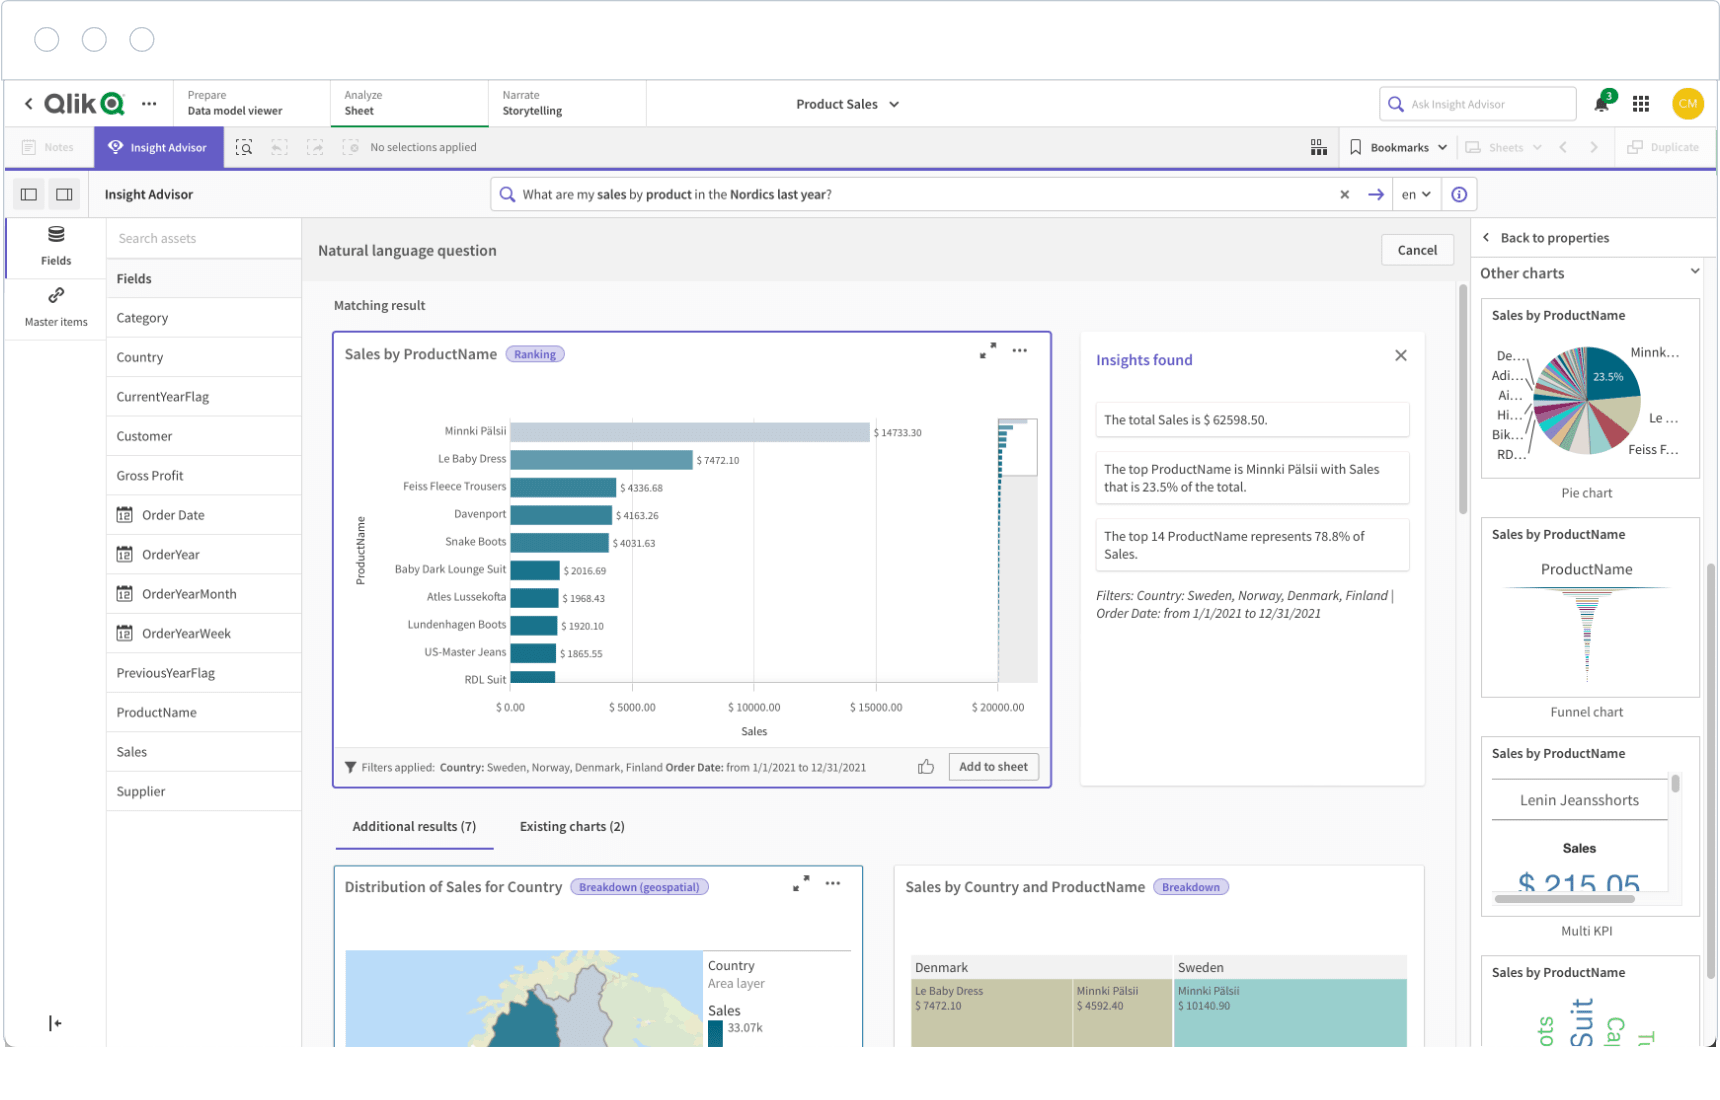
QlikView is another powerful player in the business intelligence and data visualization field, used by over 40,000 clients worldwide. Known for its associative model, QlikView allows users to explore data from multiple perspectives, providing fast and reliable insights. Its drag-and-drop interface makes it accessible to users with various technical backgrounds, while still offering the advanced features necessary for professional analysts.
Pros:
- User-friendly interface with drag-and-drop functionality
- Supports customized visualizations
- Cost-effective and simple to maintain
- Extensive community and training resources
Cons:
- Limited RAM can cause performance issues
- Lacks intuitive customer support options
4. Google Charts
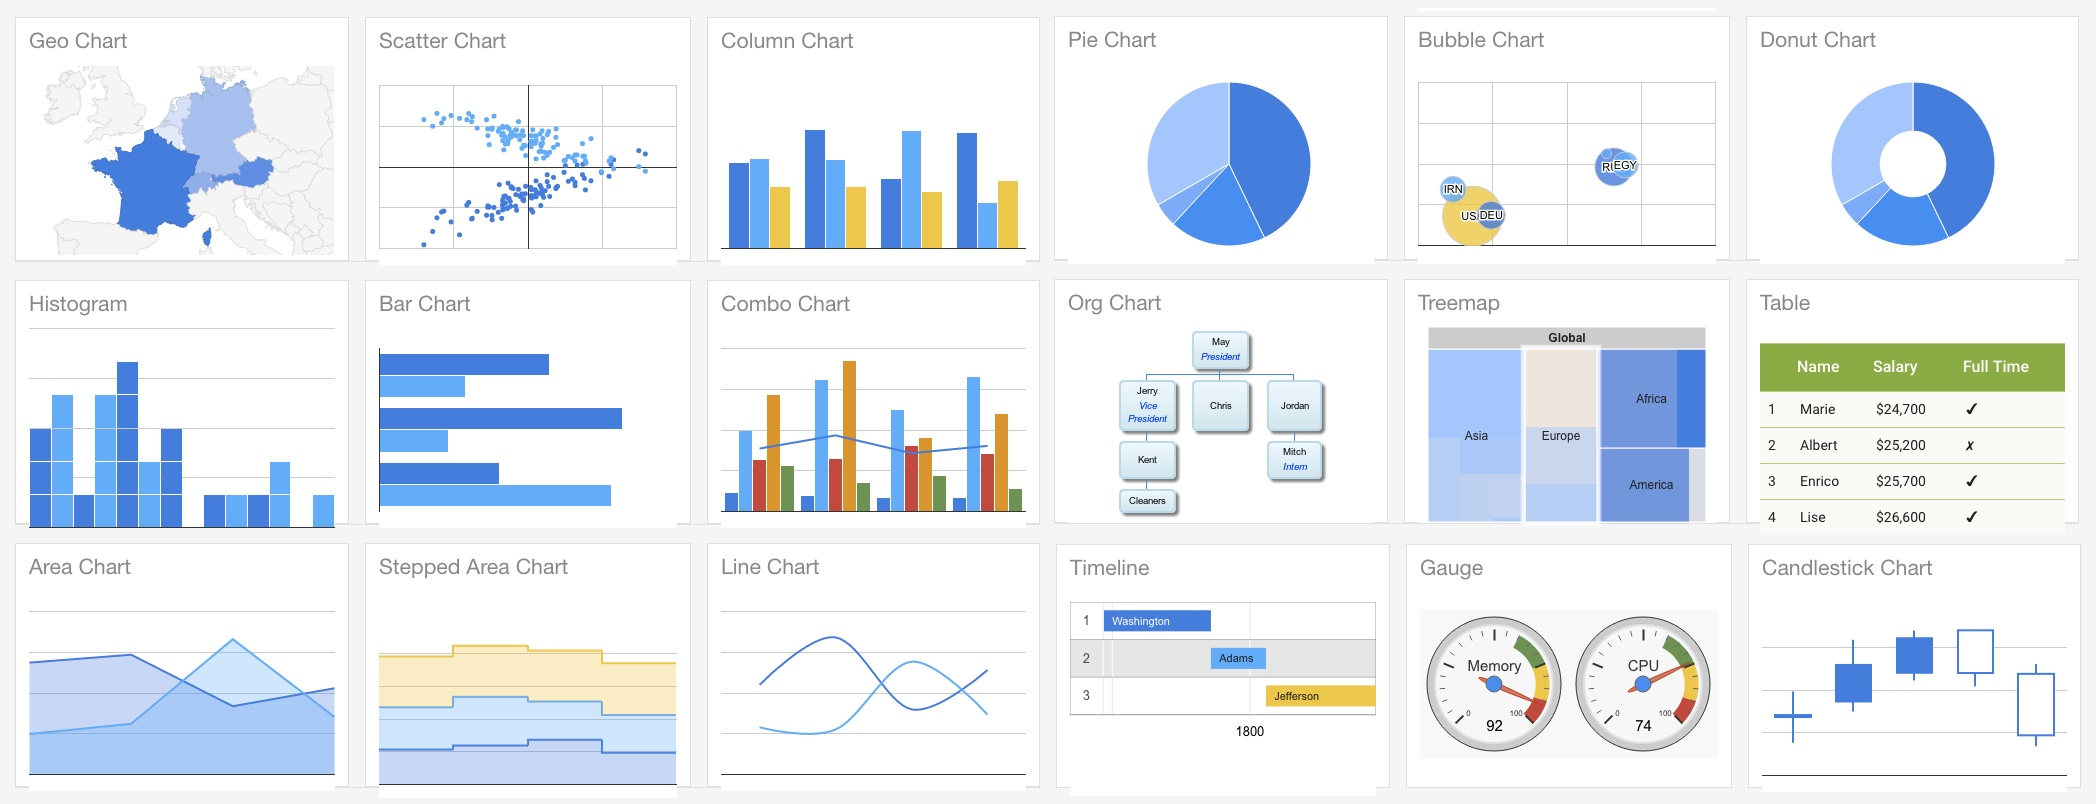
Google Charts is a free, web-based data visualization tool that excels in producing simple yet visually appealing graphics. It uses HTML5/SVG technology, allowing it to deliver cross-platform compatibility, meaning your visualizations work seamlessly across all devices, including iOS and Android. Google Charts also integrates well with other Google products, making it a practical option for organizations that already rely on tools like Google Sheets and Google Analytics.
Pros:
- User-friendly and completely free
- Seamless integration with Google services
- Cross-platform compatibility with excellent performance
- Attractive visual output
Cons:
- Lacks deep customization options
- Requires an active internet connection to use
5. Dundas BI
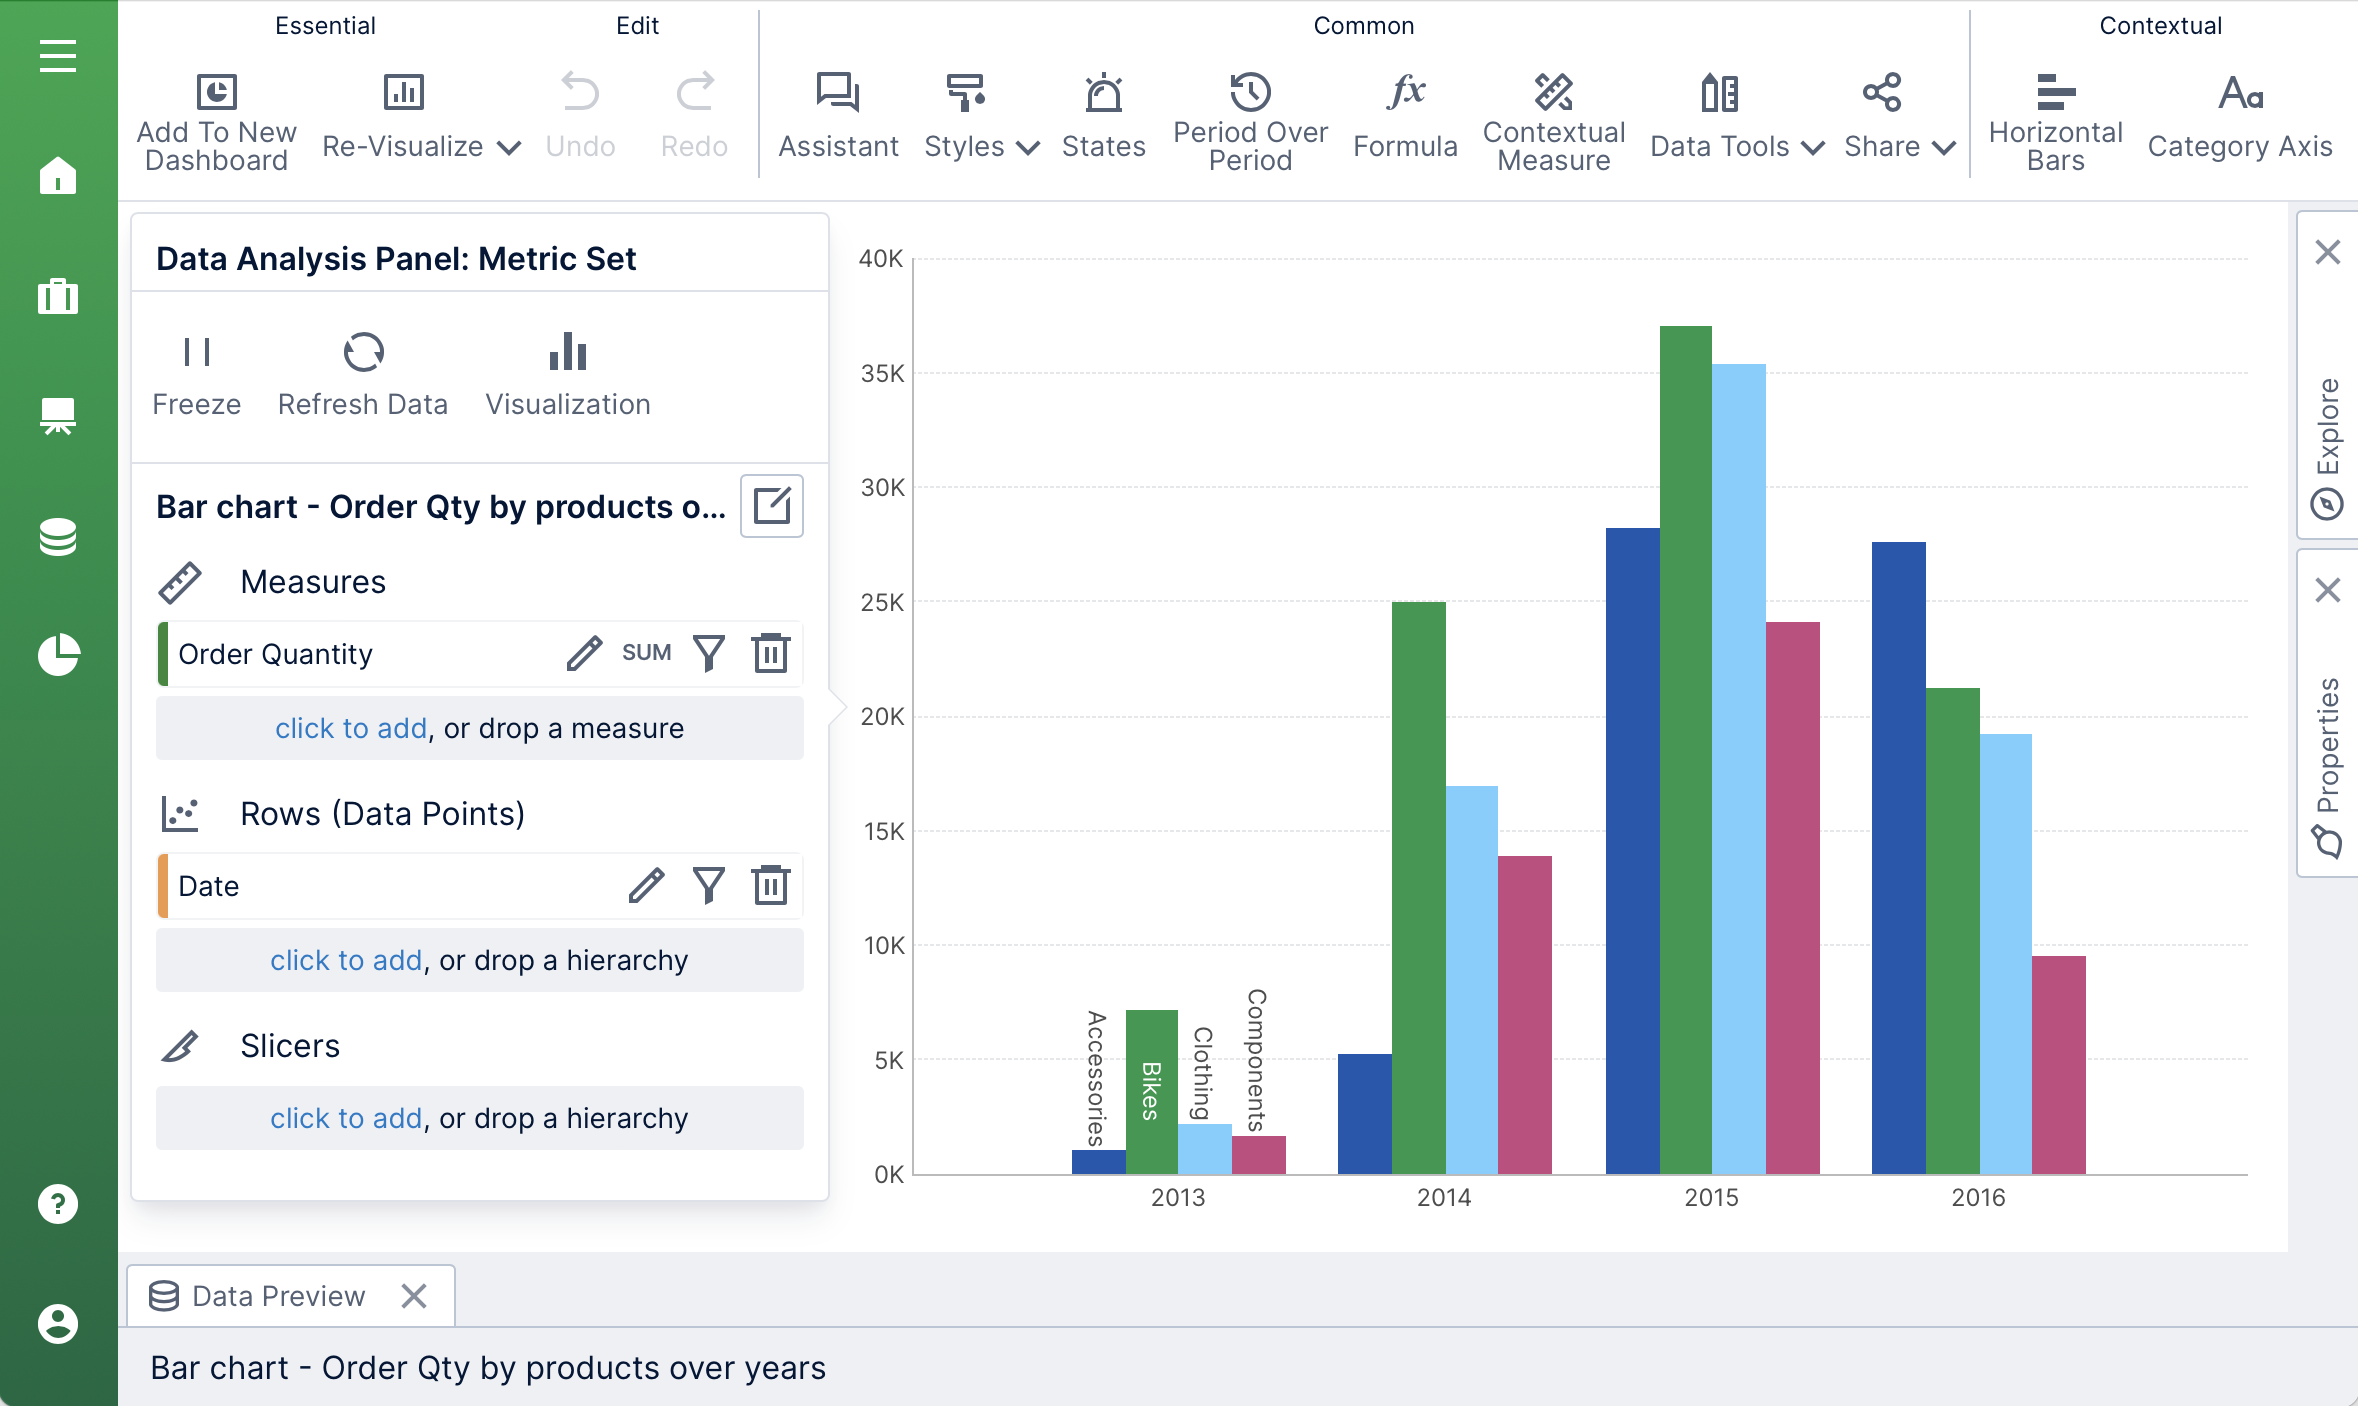
Dundas BI offers a high level of customization and flexibility, enabling users to create interactive dashboards, charts, and scorecards. It supports the integration of large datasets from multiple sources, making it an ideal choice for businesses looking to analyze big data. Dundas BI allows full control over visual elements, giving users the power to tweak everything from colors to the arrangement of charts. Its wide range of built-in data manipulation tools also helps users cleanse, transform, and model data efficiently.
Pros:
- Fully customizable dashboards and visuals
- Supports numerous data sources
- In-built tools for data transformation and cleansing
Cons:
- Does not support predictive analytics
- No 3D chart support
6. Plotly

Plotly is a well-regarded, open-source tool that offers powerful integration with analytics-focused programming languages like Python, R, and MATLAB. It is widely used in data science and research settings for creating complex, high-quality visualizations. Plotly’s interactive charts, coupled with its ability to export high-resolution images, make it ideal for professional reporting. The tool is popular for collaborative projects, where teams can share, edit, and create visualizations together.
Pros:
- Supports integration with programming languages
- Highly interactive visualizations
- Collaborative tools for team projects
- Export charts in high resolution
Cons:
- Speed can be an issue with large datasets
- Limited features in the free version
7. RAWGraphs
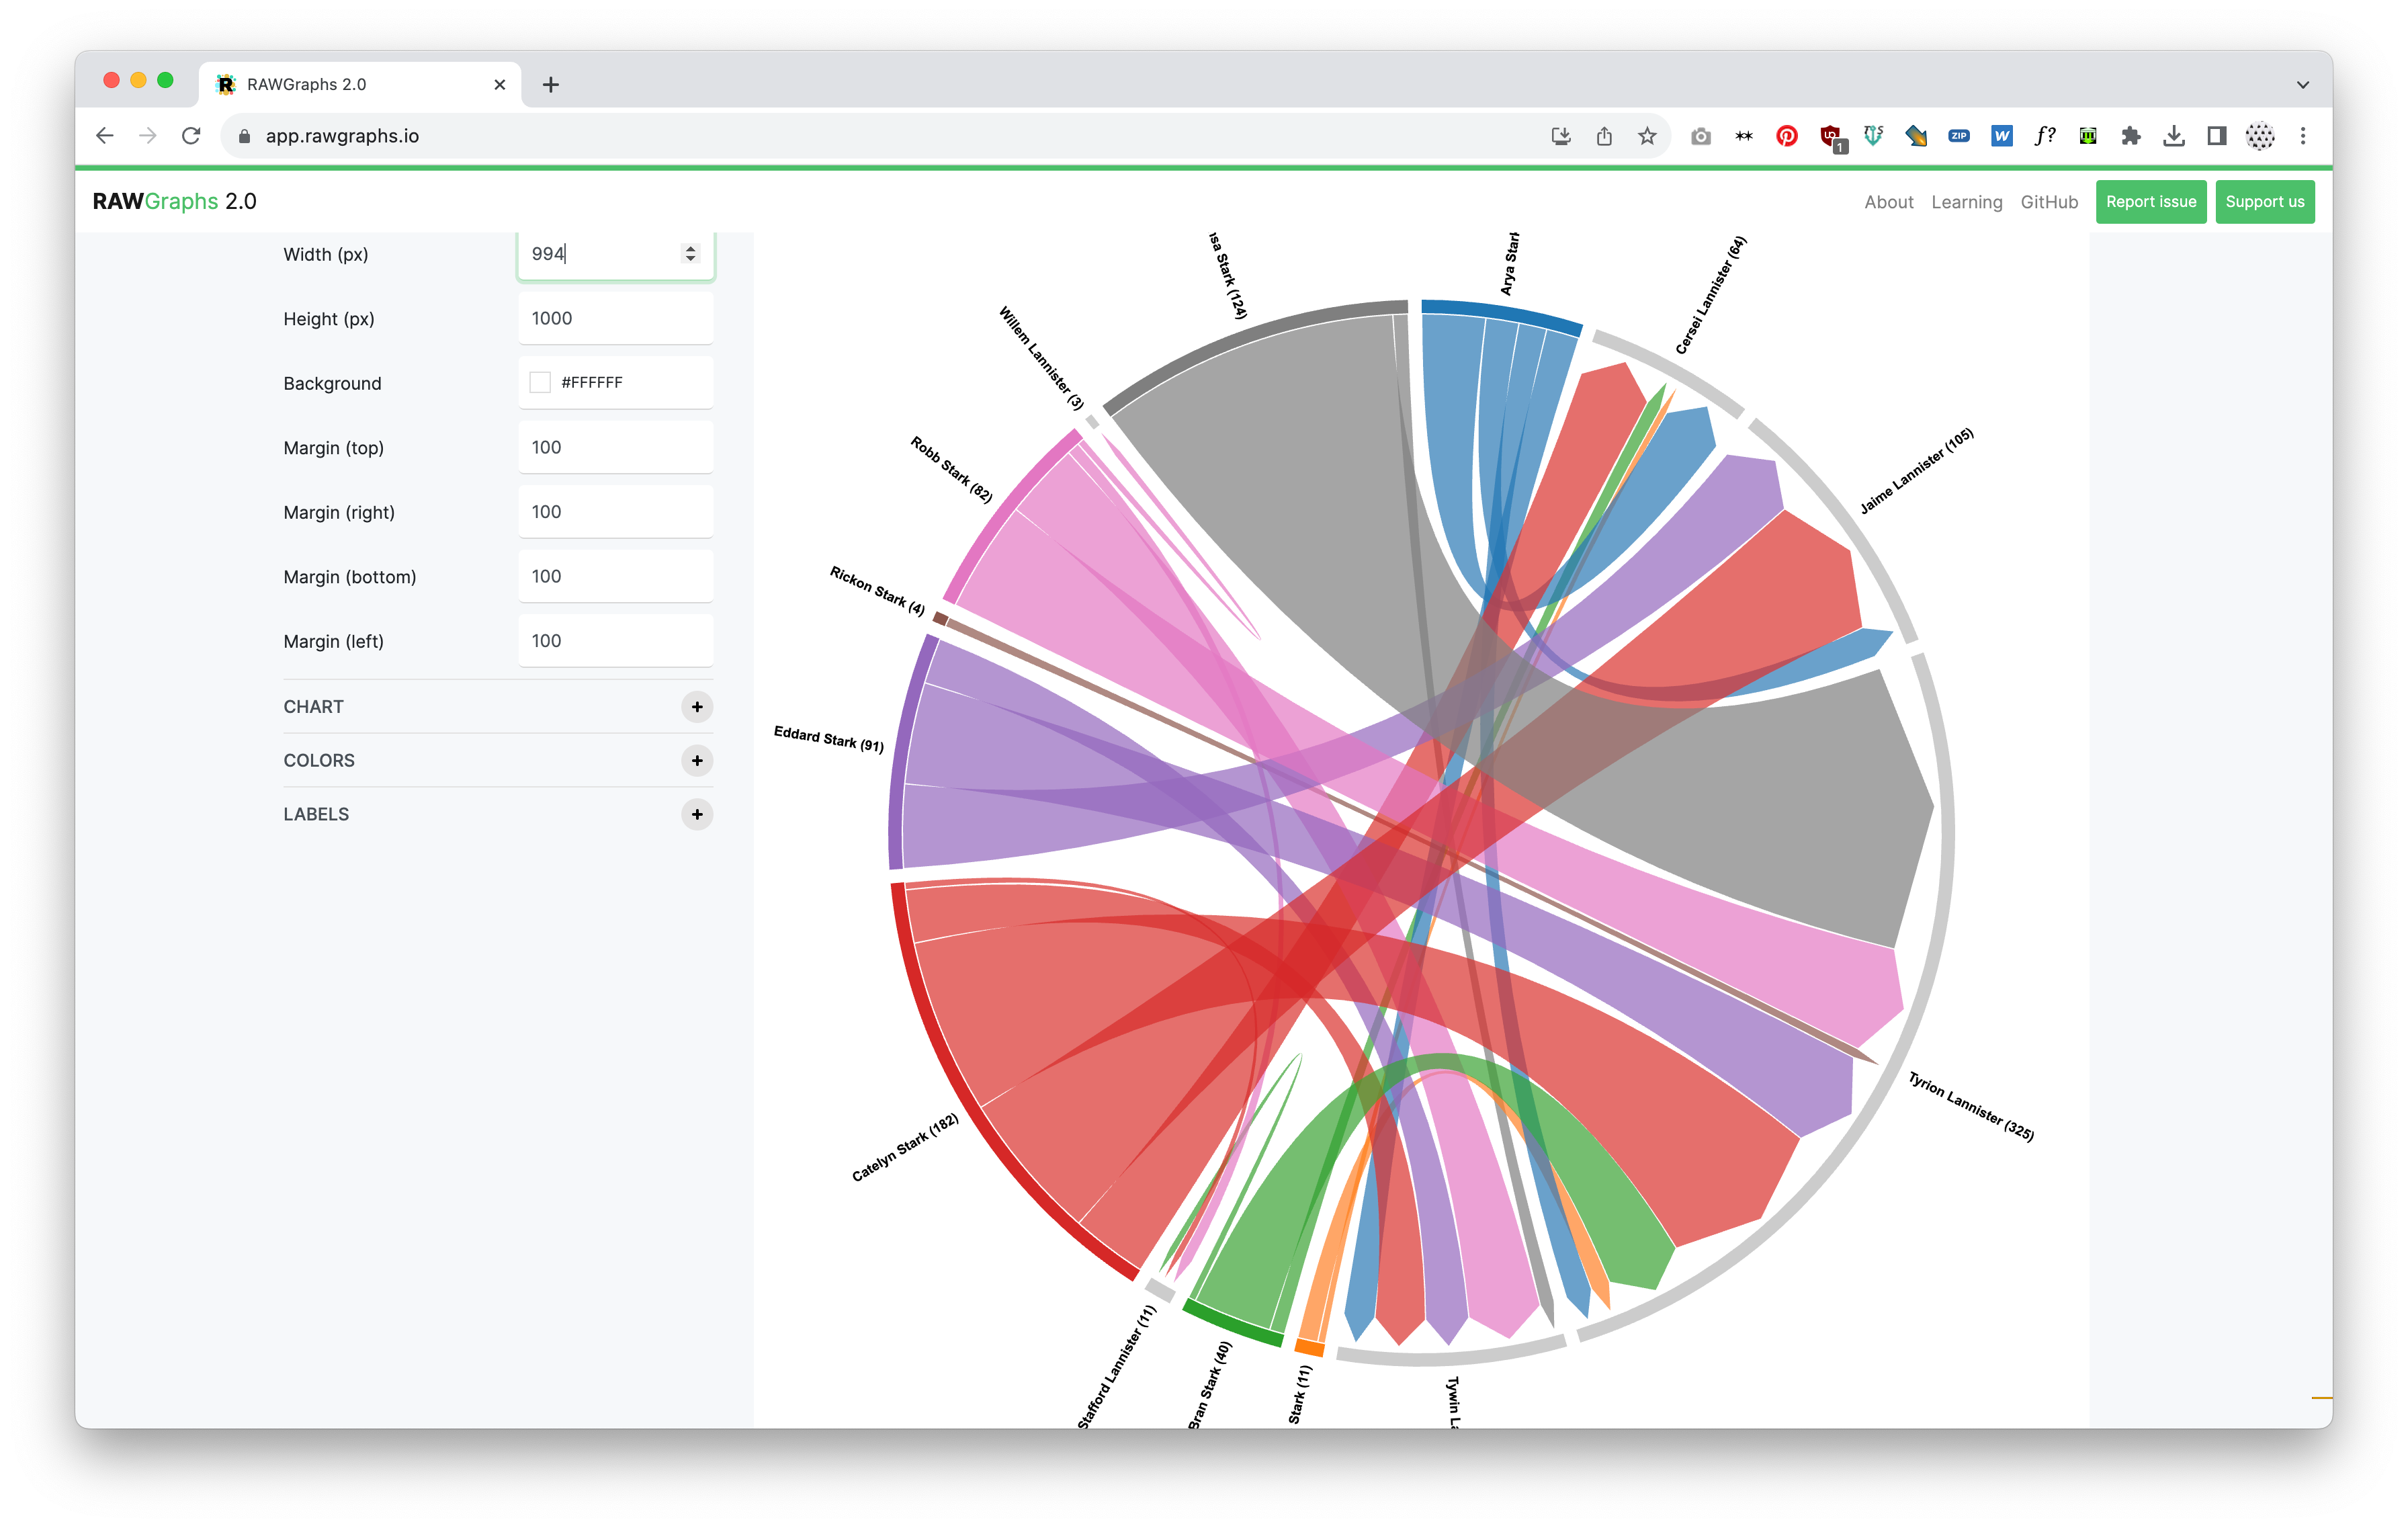
RAWGraphs is a data visualization tool that excels at bridging the gap between spreadsheets and more advanced visualizations. It supports delimited data types like CSV and TSV, making it a valuable tool for users who regularly work with raw datasets. While its user interface is simple, RAWGraphs offers both conventional and non-traditional chart types, making it perfect for those looking for flexibility. However, as a web-based tool, it lacks some advanced features found in desktop applications.
Pros:
- Simple, user-friendly interface
- Wide variety of visual layouts
- Supports delimited datasets like CSV and TSV
- Excellent for quick, basic visualizations
Cons:
- Limited features for complex data analysis
- Lacks intuitive user experience for beginners
8. IBM Watson
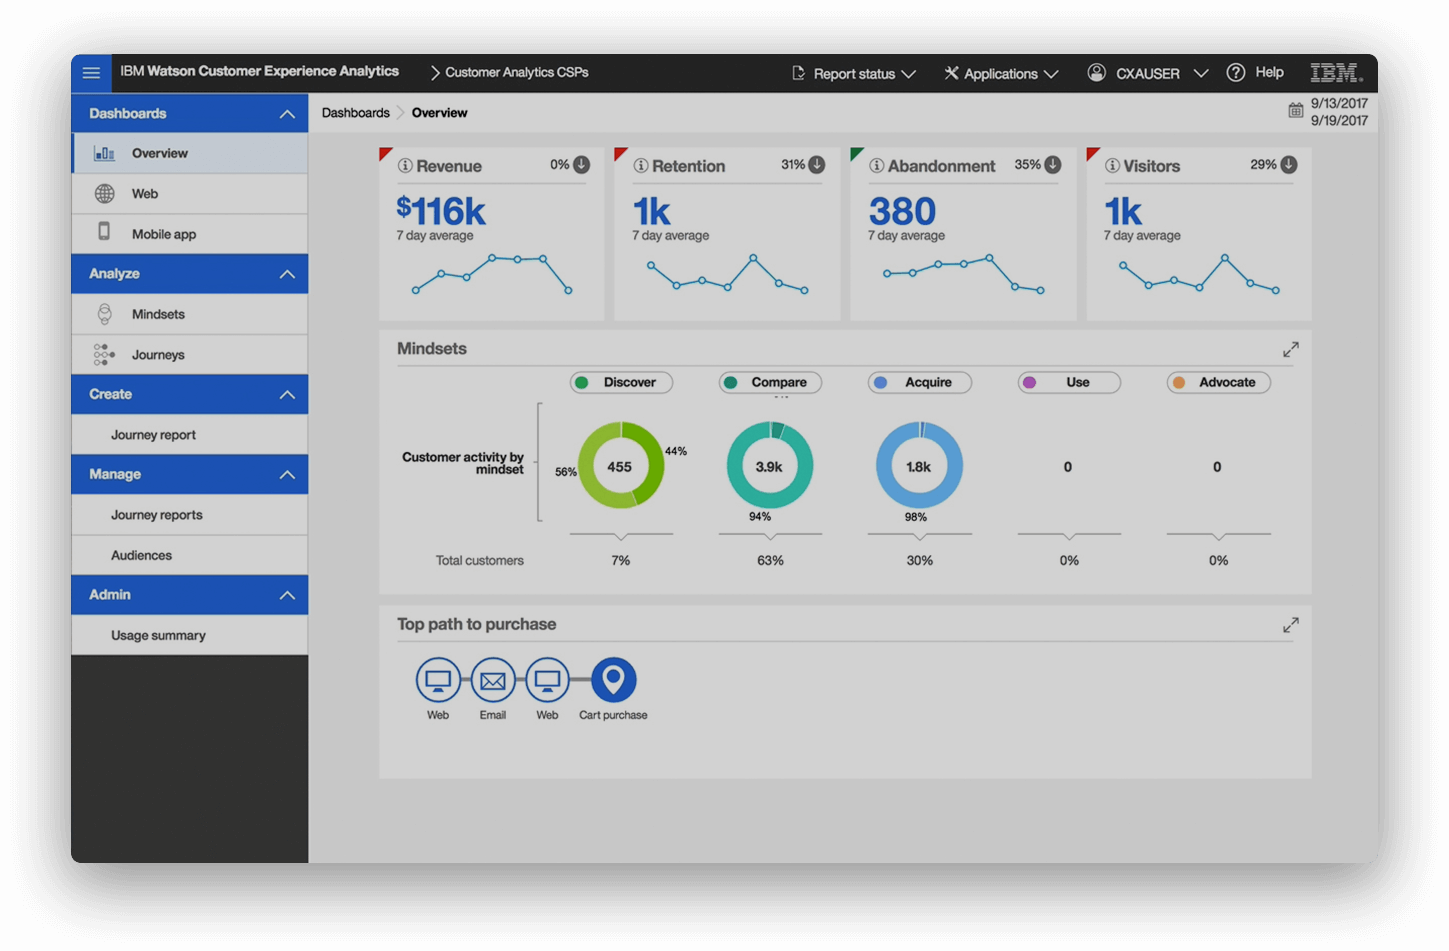
IBM Watson is a cutting-edge data visualization and analytics tool that incorporates artificial intelligence to detect insights and patterns from both structured and unstructured data. Watson uses Natural Language Processing (NLP) to help users navigate through the data discovery process. Its self-service capabilities make it accessible to business users, while advanced AI features are beneficial for data scientists and analysts.
Pros:
- AI-driven insights using NLP
- Robust self-service dashboards
- Predictive analytics capabilities
- Accessible from multiple devices
Cons:
- High maintenance costs
- Customer support could be better
9. FusionCharts
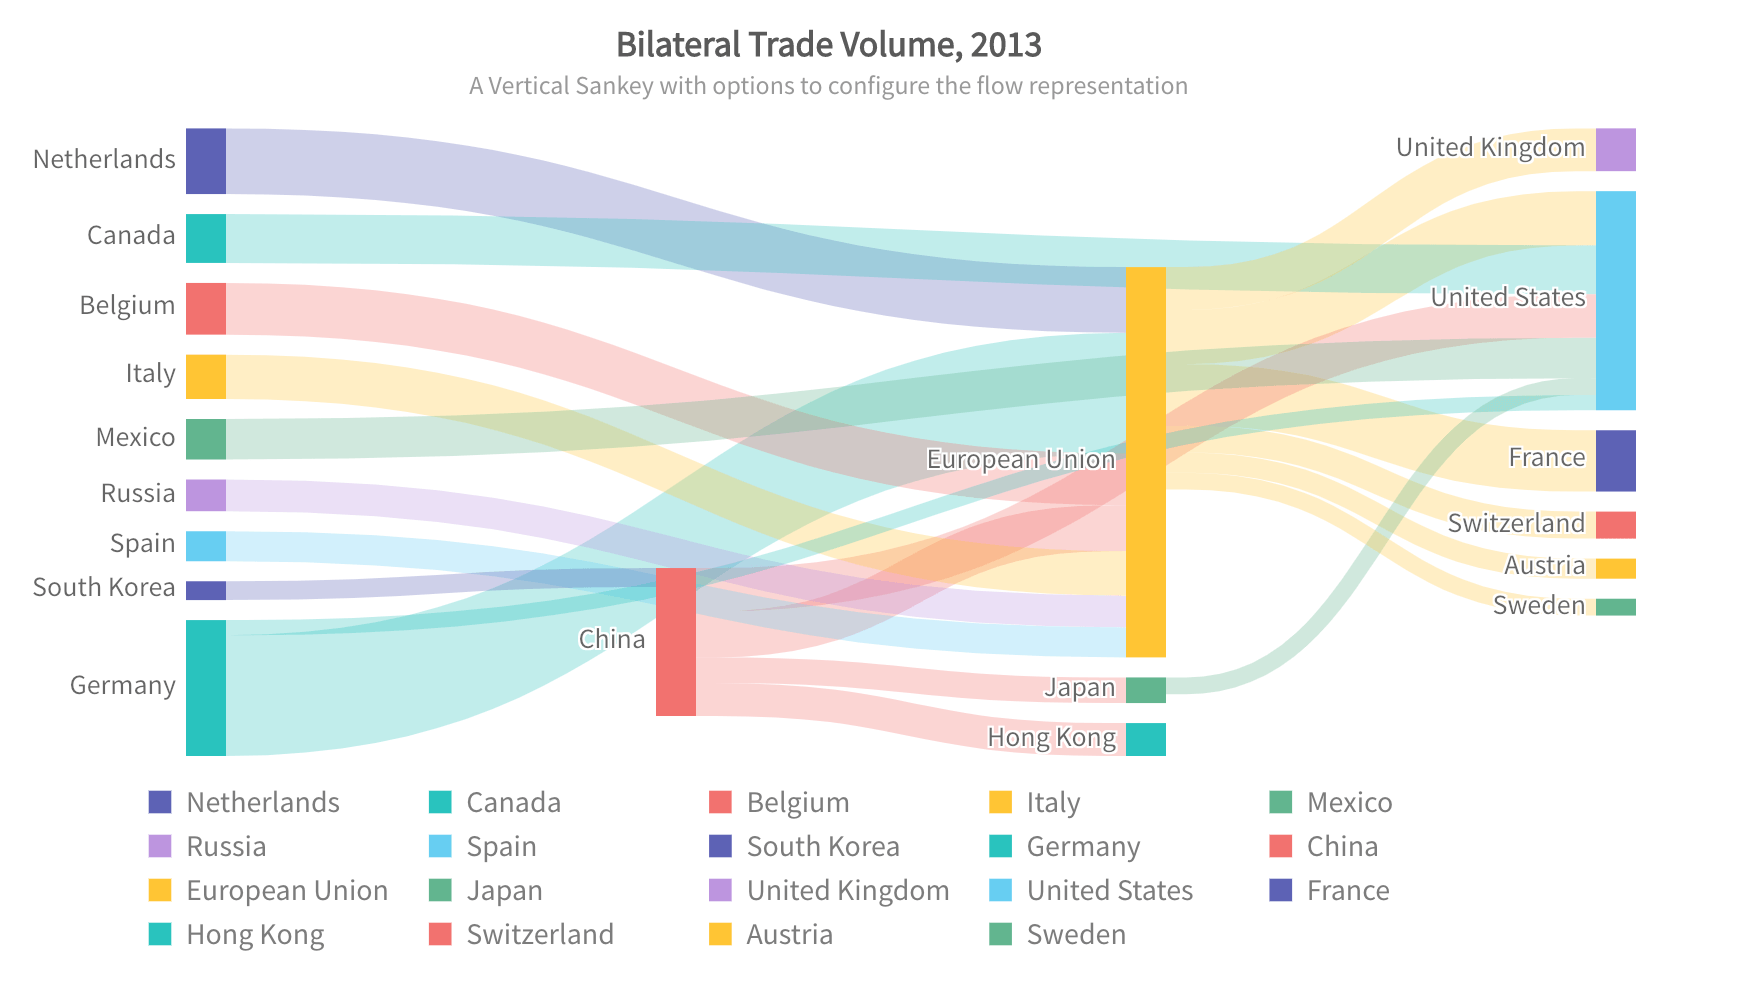
FusionCharts is a JavaScript-based data visualization tool, famous for its extensive collection of 90+ chart types. The tool integrates easily with major platforms and frameworks, allowing developers and analysts to create highly customized visualizations. FusionCharts is particularly suitable for enterprise-level use due to its scalability and range of features. However, its complex setup process and higher cost make it more appropriate for larger organizations.
Pros:
- Large variety of chart types
- Seamlessly integrates with various platforms
- Excellent customer support
Cons:
- Higher price point
- Complex setup for beginners
10. Highcharts

Highcharts is a versatile, high-performing tool widely adopted by major enterprises for its ability to handle streaming big data. It uses a JavaScript API and supports cross-browser functionalities, making it suitable for businesses looking for flexible deployment. Highcharts provides stunning, customizable graphics with support for multiple chart layouts. However, it is not recommended for smaller businesses due to its complexity and higher cost.
Pros:
- High degree of customization
- Interactive and visually stunning charts
- Cross-browser compatibility
Cons:
- Not ideal for small organizations
- Steeper learning curve for novice users
11. Zoho Reports
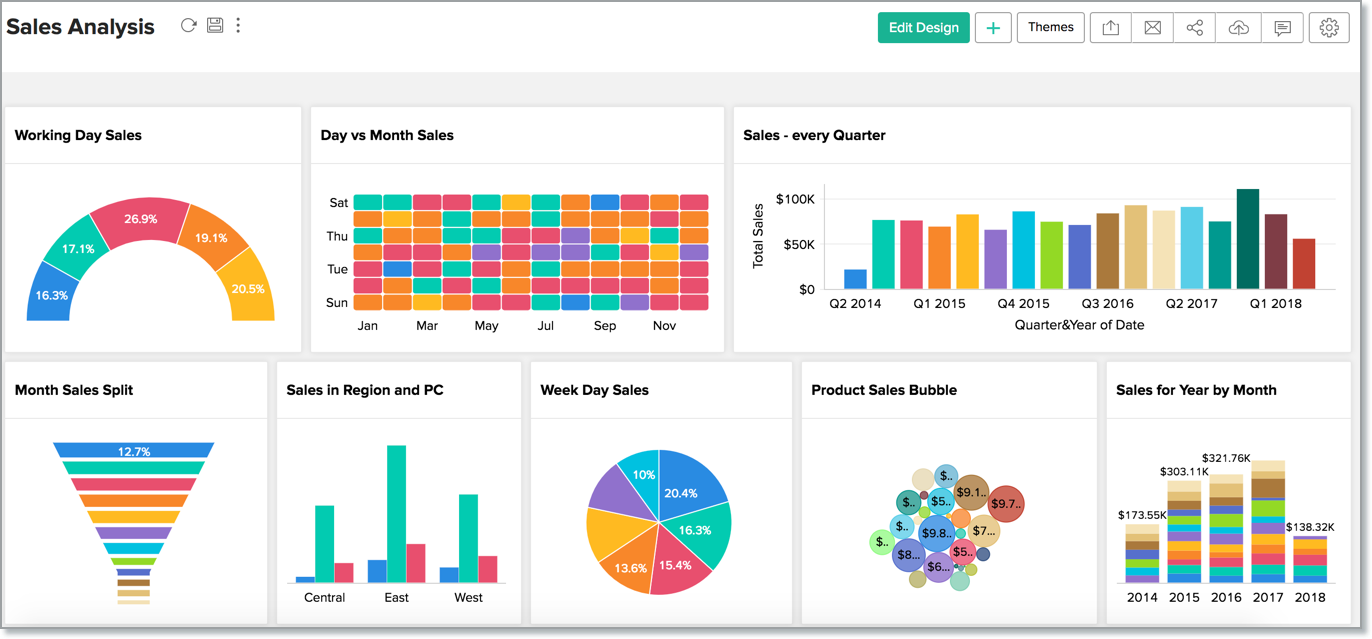
Zoho Reports, now called Zoho Analytics, is an intuitive data visualization tool that is ideal for business users who need quick, actionable insights. It allows users to import data from major databases and create detailed reports and visualizations quickly. With features like email scheduling and report sharing, Zoho Analytics streamlines the process of generating insights and distributing them across teams.
Pros:
- Quick report creation and modification
- Easy integration with other Zoho products
- Excellent customer support
Cons:
- User training could be more robust
- Dashboard can become cluttered with large datasets
12. Data Wrapper
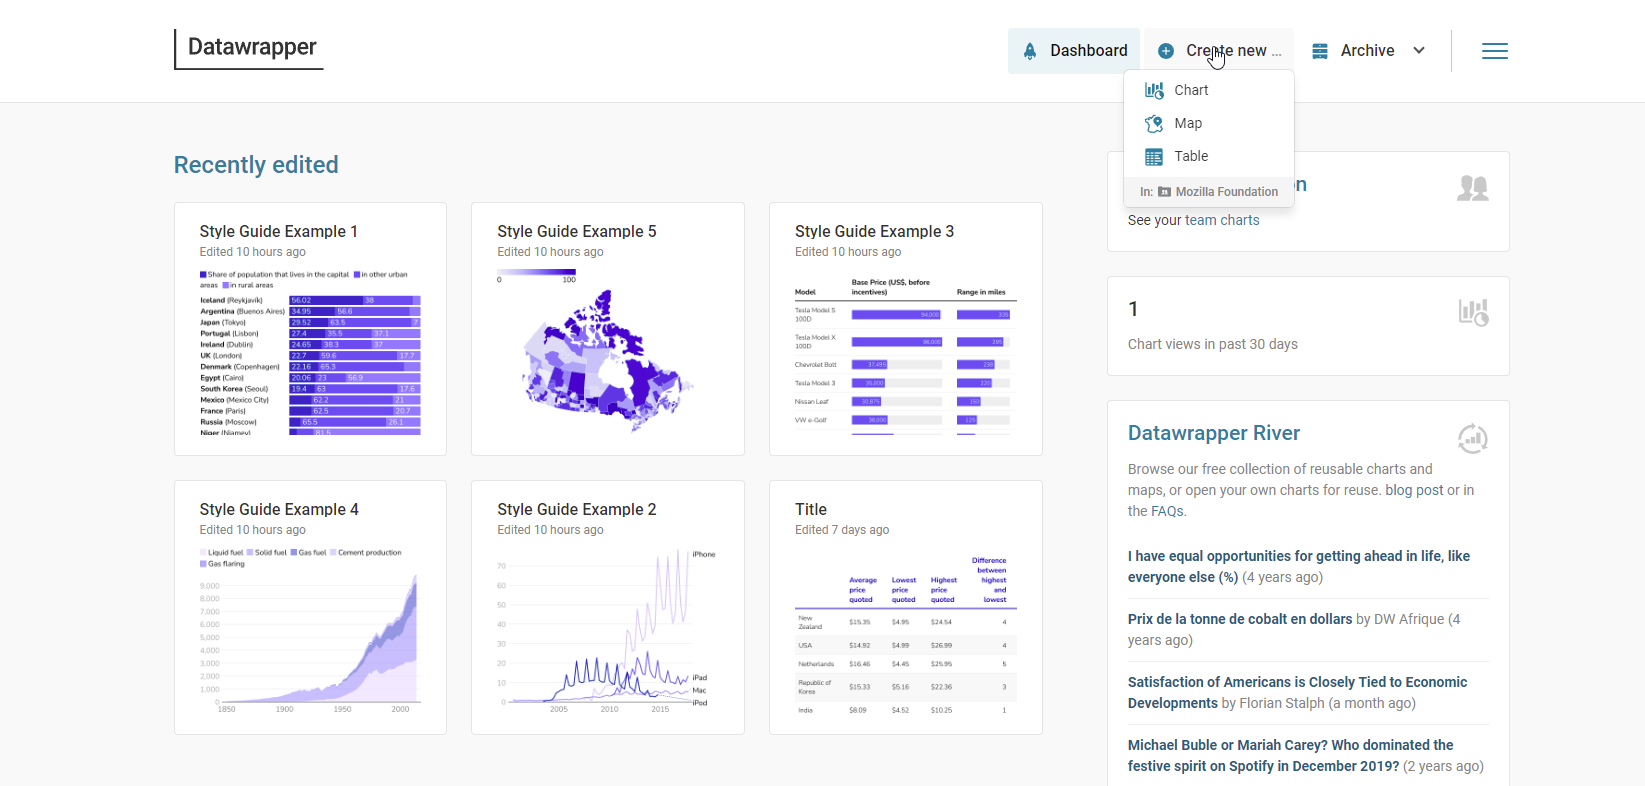
Data Wrapper is a free, web-based visualization tool that is particularly popular among media organizations for creating quick, embeddable charts. The tool’s simple interface allows users to generate visually appealing graphics without requiring any prior technical knowledge. It’s an excellent option for anyone needing to produce basic charts on the fly but lacks the complexity necessary for advanced visualizations.
Pros:
- No software installation required
- Free to use and beginner-friendly
- Ideal for creating quick, embeddable charts
Cons:
- Limited support for complex charts
- As an open-source tool, it may present security risks
13. Sisense
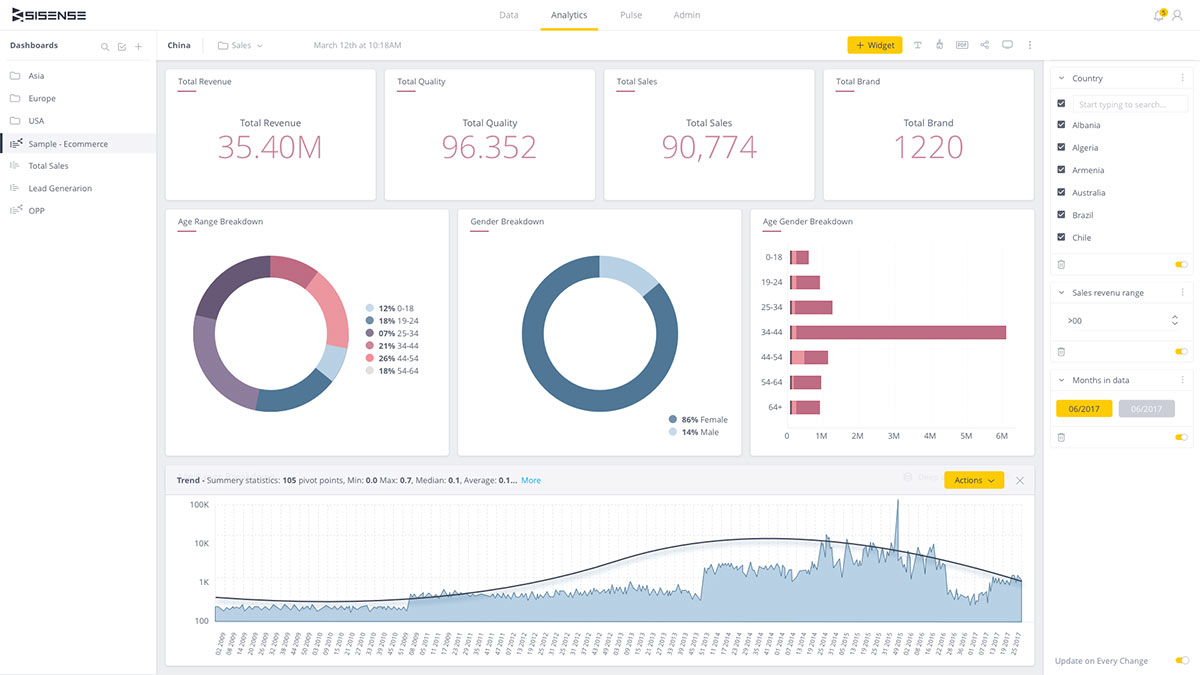
Sisense is a highly agile data visualization tool known for handling massive datasets and supporting mission-critical projects. It offers a robust, flexible interface that allows for seamless customization, and is particularly strong in summarizing key patterns in large volumes of data. Sisense is a great option for enterprises that need to visualize data quickly while maintaining high performance, but the setup can be challenging for new users.
Pros:
- Excellent for handling large datasets
- Quick to set up with a flexible interface
- Outstanding customer support
Cons:
- Complicated for beginners
- Limited support for time formats in visualizations
Drawbacks of Traditional Data Visualization Tools
Traditional data visualization tools, while powerful, often come with significant drawbacks that can hinder accessibility and efficiency.
These tools frequently require a steep learning curve, making it difficult for non-technical users to fully harness their capabilities. Organizations often rely on data analysts or specialized teams to manage data input, transformations, and the creation of visual representations, which adds complexity and delays in decision-making.
The setup and integration processes are typically intricate, requiring extensive configuration to connect multiple data sources, and this complexity often demands dedicated IT support.
Additionally, traditional tools can be inflexible. Customizing visualizations beyond pre-built templates can be a labor-intensive process, requiring in-depth technical knowledge of the tool’s functions or scripting capabilities.
As datasets grow in size and complexity, the ability to interact with real-time data becomes more challenging, and many tools struggle to handle the dynamic nature of modern data environments.
The future of data visualization lies in AI-powered tools and natural language interfaces, which make querying data and generating visual insights more intuitive and accessible.
Tools like Sequel are at the forefront of this evolution, allowing users to query databases in plain English, significantly reducing the need for technical expertise.
This shift enables real-time exploration of data, faster insights, and greater collaboration across teams without the bottlenecks traditionally associated with data analysis. By removing the barriers of complex configurations and specialized knowledge, AI-driven platforms are transforming how organizations engage with their data.
Sequel Is The Future Of Data Visualization
In the past, data analysis was primarily the responsibility of specialized IT or data teams who handled everything from data extraction to report generation. These centralized processes were time-consuming, and only a select few had access to the insights. As the demand for faster, more agile decision-making has grown, traditional tools have struggled to keep up.
Today, businesses need real-time insights that can be accessed by anyone across the organization, not just the data experts.
Enter Sequel, a modern, user-friendly data solution designed to simplify the way businesses interact with their data.
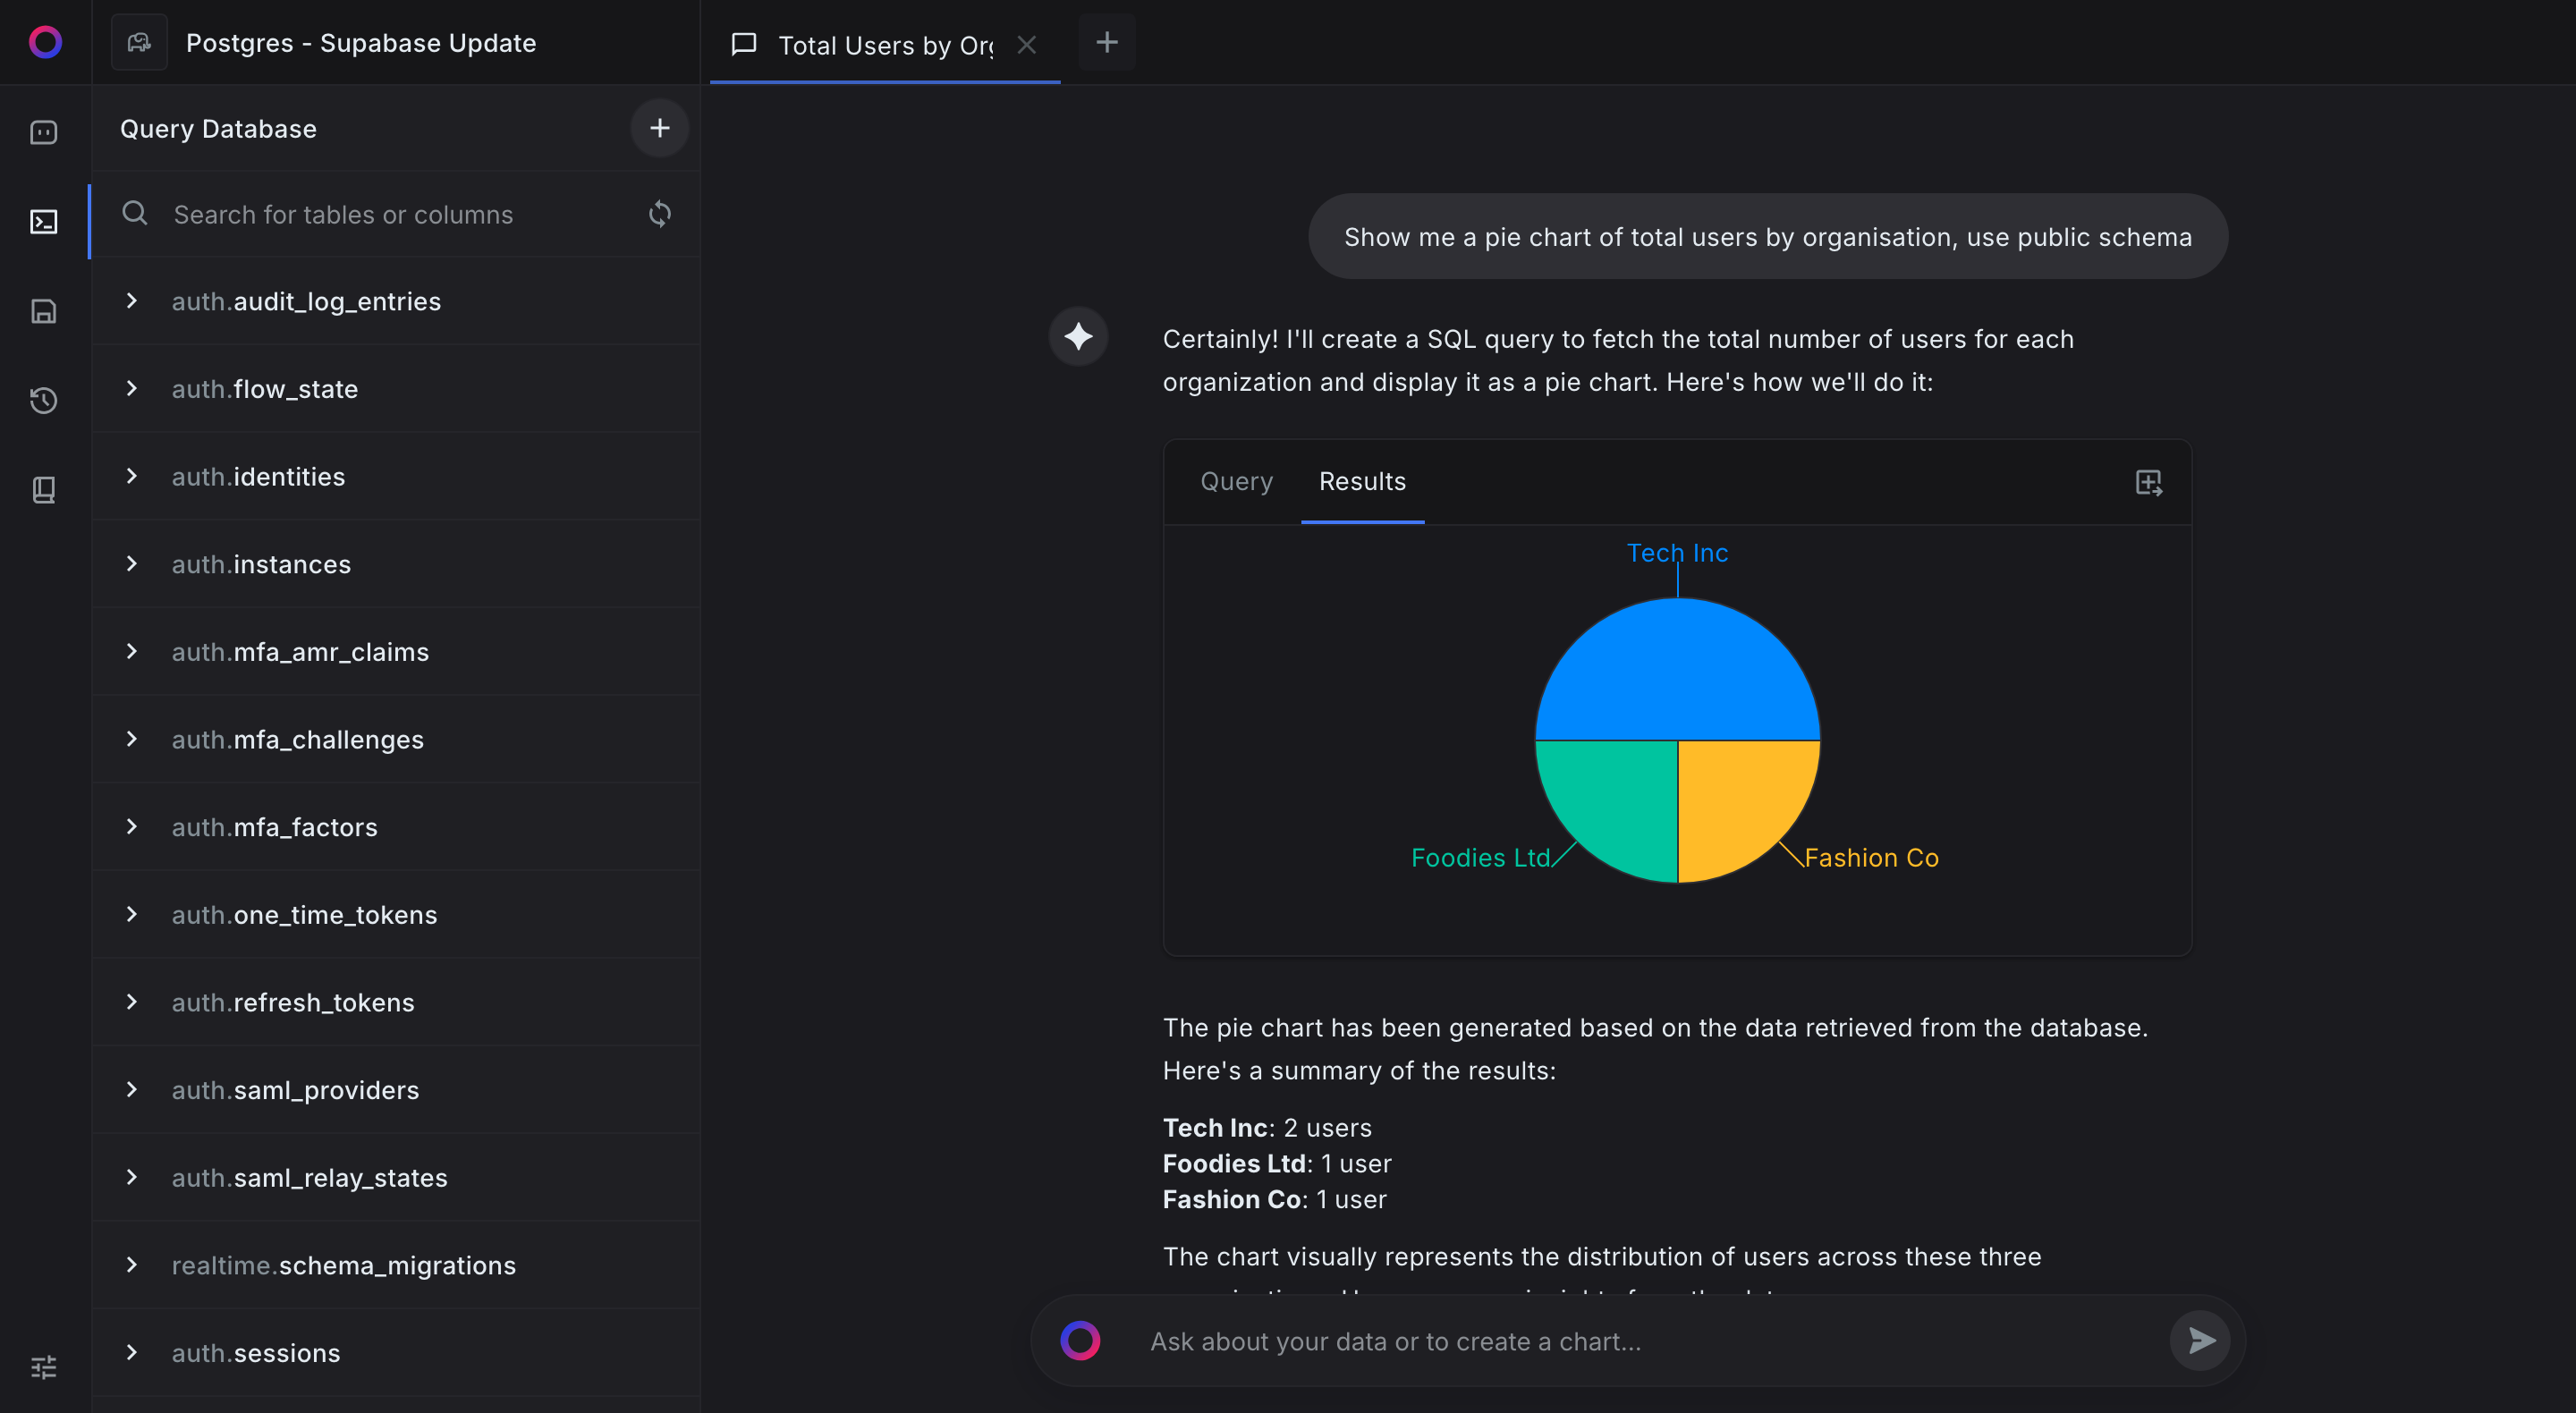
With Sequel, you can:
- Ask questions in plain English.
- Have an AI assistant uncover hidden insights in your data
- Get real-time insights without writing SQL.
- Visualize your data effortlessly.
All you have to do is connect your database - and you can get chatting!
Don’t believe us? Try it out for free today!
FAQs
What are data visualization tools?
Data visualization tools transform raw data into visual formats like charts, graphs, and dashboards, simplifying data analysis. However, many require technical expertise to generate insightful visuals.
Why are data visualization tools important?
Data visualization tools help businesses understand complex data and make informed decisions, though they often require data analysts for optimal use due to their complexity.
What are the top data visualization tools in 2024?
Top data visualization tools in 2024 include Tableau, Power BI, and Looker. Tools like Sequel.sh, however, simplify the process by letting users query databases in plain English.
How to choose the best data visualization tool?
When selecting a tool, consider ease of use, integration capabilities, and the level of technical expertise required. Tools like Sequel.sh prioritize simplicity by minimizing technical barriers.
What are free data visualization tools?
Free tools like Google Data Studio, Microsoft Power PI, and Tableau Public offer basic visualizations.
What industries benefit most from data visualization tools?
Industries like finance, healthcare, and marketing rely on data visualization tools. For businesses without dedicated data analysts, tools like Sequel.sh allow users to query data without technical skills.
Can data visualization tools handle big data?
Advanced tools like Tableau and Power BI can handle big data, but managing these tools may require a data expert. Sequel’s approach simplifies access to large datasets for non-technical users.
Are data visualization tools easy to use?
Most tools have steep learning curves and may require specialized knowledge. Sequel stands out by allowing anyone to access and visualize data without advanced training.
How secure are data visualization tools?
Data visualization tools provide robust security features, but navigating these settings can be tricky. Tools like Sequel focus on user-friendliness while maintaining security standards.
Start exploring your data with Sequel
Save hours of time writing SQL queries. Get started for free.
