
You type "show me weekly signups for the last quarter." Two seconds later there is a line chart. What happened in between is a multi-stage pipeline, and the best way to understand it is to look at how Uber, Pinterest, and LinkedIn actually built theirs.
This is the technical companion to what an AI data analyst is. All three companies published detailed write-ups, and their architectures agree on the hard parts. We will walk the pipeline, then show how each team solved the stages that matter most.
The pipeline in one view
Every capable AI data analyst runs roughly these stages.
| Stage | Input | Output |
|---|---|---|
| 1. Schema understanding | Database connection | A map of tables, columns, and joins |
| 2. Table selection | Question + schema | The few relevant tables |
| 3. Question to SQL | Question + selected schema | A SQL query |
| 4. Validation | Generated SQL | A safe, checked query |
| 5. Execution | Validated SQL | Result rows, read-only |
| 6. Visualization | Result rows | A chart or table |
Skip any stage and quality drops. Stages 2 and 3 are where the engineering effort concentrates.
Stage 1: schema understanding
On connection, the tool introspects your database. It reads table names, column names, data types, and the keys that link tables. Some tools sample a few values to learn that status holds active and churned.
This map is the difference between a guess and a correct query. The model is not writing SQL for a generic store. It writes for your orders table and your customer_id column. Clear names help; cryptic ones like col1 hurt.
Stage 2: table selection, the real bottleneck
Here is the stage demos skip and production systems obsess over. In a real warehouse, the model cannot see every table at once, and most tables are irrelevant to any given question.
Pinterest stated the problem plainly: "identifying the correct tables amongst the hundreds of thousands in our data warehouse is actually a significant challenge for users". Their fix was retrieval-augmented generation: build a vector index of table summaries and past queries, embed the user's question, retrieve the top candidates, and let the user confirm before generating SQL. They also found that table documentation mattered enormously, with search hit rate climbing from 40% to 90% as documentation weight increased.
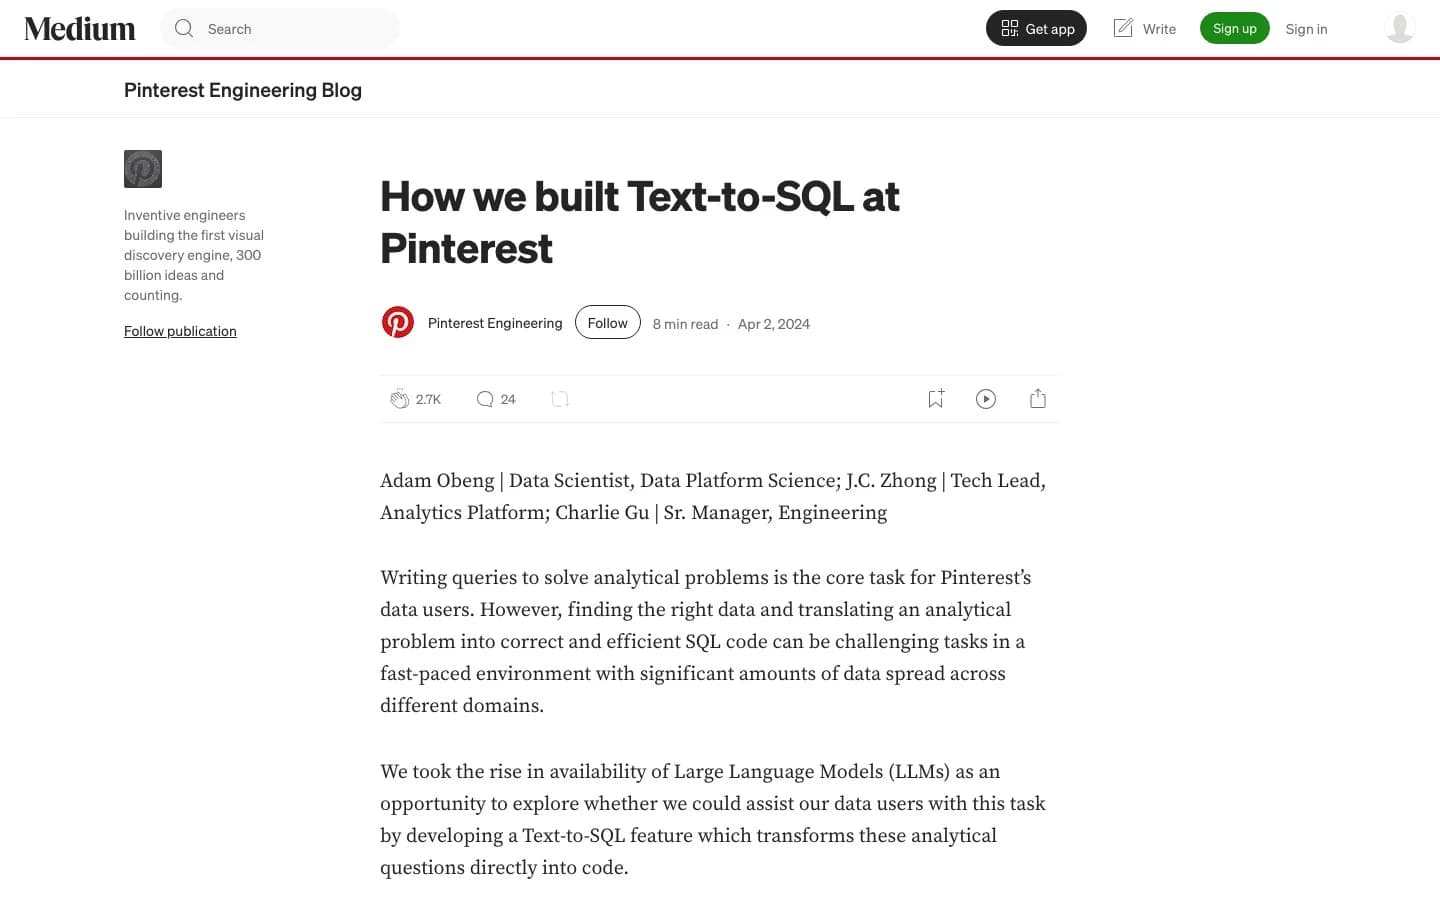 Pinterest's engineering write-up on building Text-to-SQL, source: Pinterest Engineering on Medium
Uber's QueryGPT takes a similar path with named agents:
- Intent Agent maps the question to a business domain, or "workspace" (Mobility, Ads, Core Services)
- Table Agent picks and validates the tables, with user confirmation
- Column Prune Agent strips irrelevant columns to fit the context window
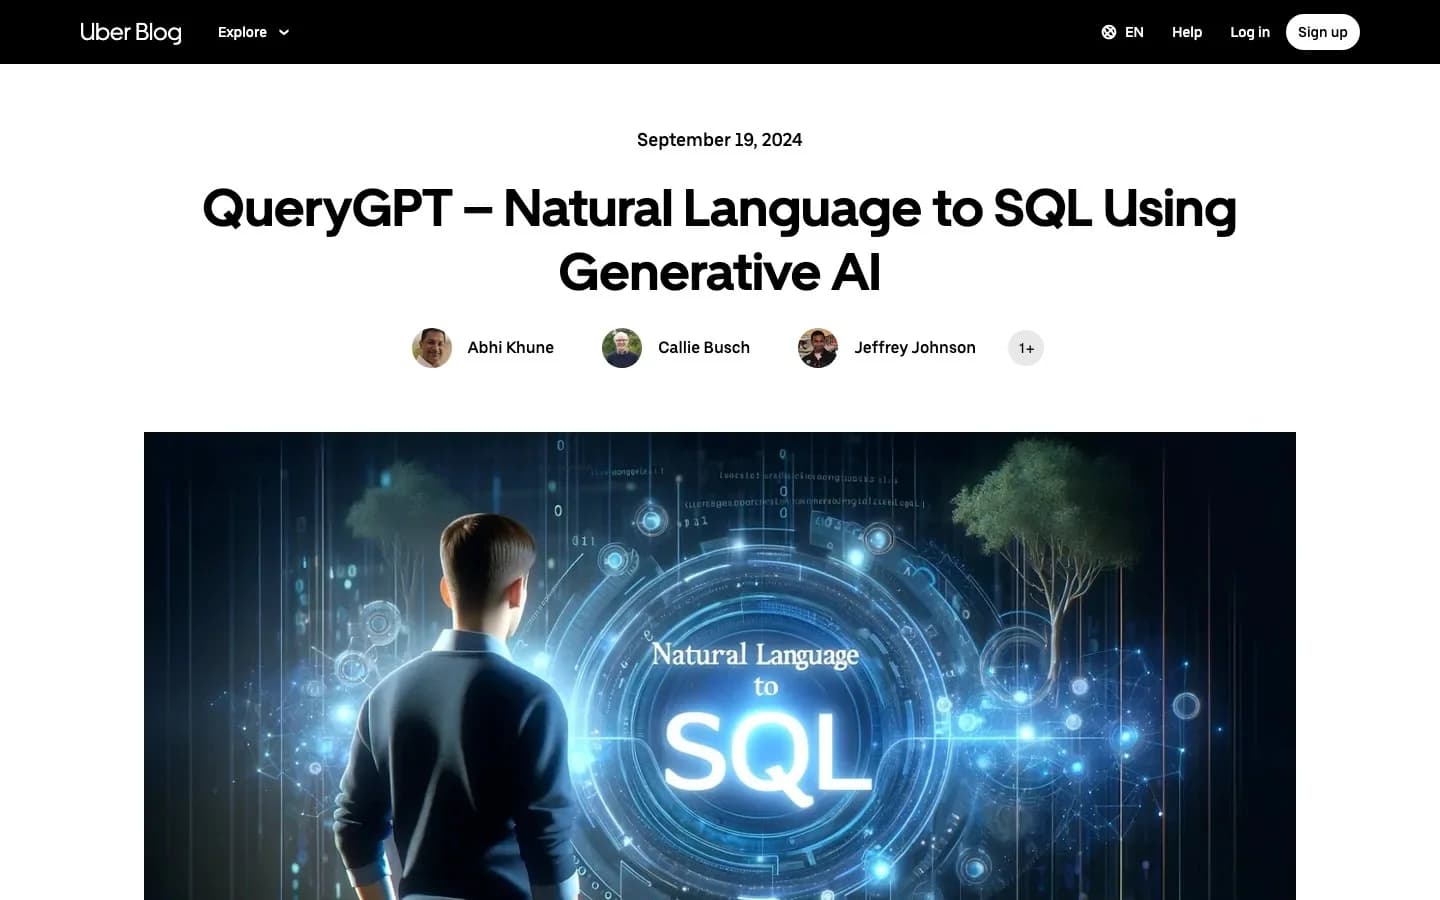 Uber's QueryGPT breaks table selection into named agents, source: Uber Engineering Blog
LinkedIn's SQL Bot layers a knowledge graph (schemas, field descriptions, access patterns, certified queries) under embedding-based retrieval, then uses an LLM re-ranker to cut 20 candidate tables down to the 7 it passes to generation.
The lesson for any AI data analyst: getting the right tables in front of the model is most of the battle.
Stage 3: turning your question into SQL
This is the text-to-SQL step. The model receives your question plus the selected schema and produces a query. We go deep in how text-to-SQL works.
A plain-English ask like "revenue by plan last month" becomes:
SELECT plan, SUM(amount) AS revenue
FROM subscriptions
WHERE created_at >= date_trunc('month', current_date - interval '1 month')
  AND created_at <  date_trunc('month', current_date)
GROUP BY plan
ORDER BY revenue DESC;
Uber uses few-shot prompting here, feeding the model a handful of similar example queries so it matches house style and join patterns. Good tools show you this SQL so you can read it, not just trust it.
Stage 4: validating the query before it runs
A generated query is a draft. Before it touches the database, a careful tool checks it: does it parse, reference real columns, and read rather than write? This catches the obvious failures early, and it is where a destructive query gets stopped.
Production teams go further with a correction loop. LinkedIn reported that 80% of SQL Bot sessions use its "Fix with AI" feature, which feeds errors back to the model to repair the query. Generation plus self-correction beats generation alone.
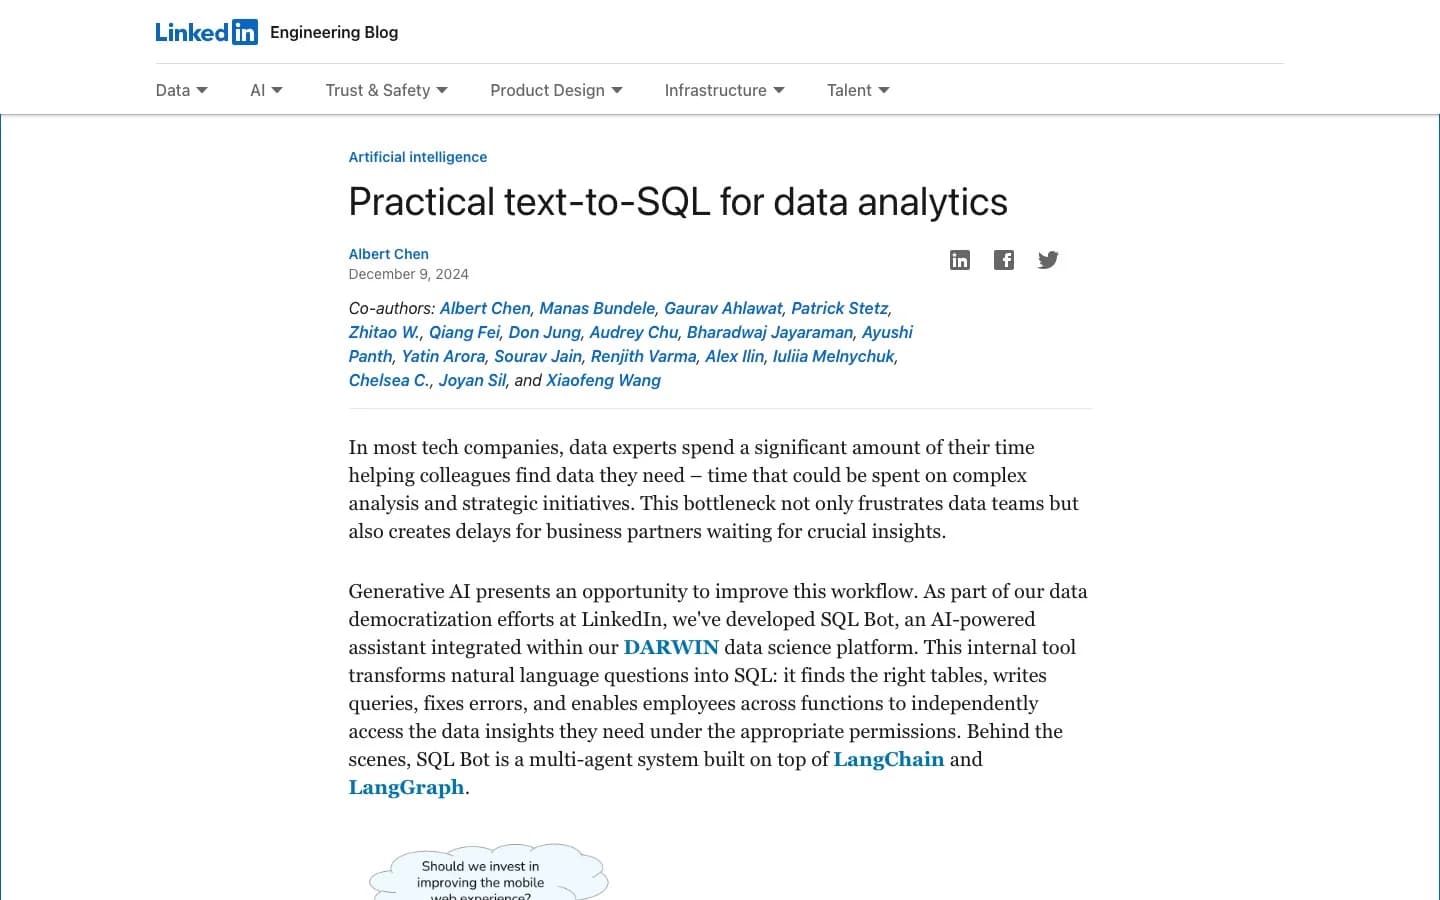 LinkedIn's SQL Bot pairs a knowledge graph with a self-correction loop, source: LinkedIn Engineering Blog
Stage 5: running it, read-only
The validated query runs against your database. The single most important safety control is the connection itself. A read-only user can run SELECT and nothing else, so even a flawed query cannot mutate data. Our read-only PostgreSQL user guide walks through the setup.
Results come back for that question. They do not need to be stored. Sequel returns results as context for the conversation and does not keep them permanently.
Stage 6: from rows to a chart
Raw rows are hard to read. The final stage matches the result shape to a visualization. A date column and a metric become a line chart. Categories and counts become bars. The tool picks a sensible default, and you can change it. This is what turns a query result into something you can drop into a Slack thread or a board deck.
What this means for accuracy
The pipeline is not magic, and practitioners are clear-eyed about it. In a widely read r/dataengineering thread, one engineer's verdict on getting real value was blunt:
"If you just want to blindly let it write SQL it won't work well. If you take the effort to actually curate datasets, make semantic models, describe columns in detail etc. it can work quite well. But it takes quite a lot of effort to get there."
That matches what Uber, Pinterest, and LinkedIn built: the model is the easy part, and context engineering is the work. We cover the numbers behind accuracy in how accurate text-to-SQL is.
Why memory makes it smarter
A one-off question is easy. The compounding value comes from memory. When the tool remembers your schema, your past queries, and how your team defines a term, the next question lands closer on the first try. Pinterest saw exactly this: first-shot acceptance climbed from 20% to over 40% as users and the system learned together.
That shared context is what makes an AI data analyst a team tool rather than a clever demo. Sequel keeps shared memory across a team workspace.
Want to watch the pipeline run on your own schema? Get started free or see the full feature set.