
Self-service analytics has been the goal for over a decade. Buy a tool, give people access, and let them answer their own questions. The tools shipped. The self-service mostly did not.
The gap between the promise and the result is the most useful thing to understand about self-service analytics. This guide defines it clearly, lays out the real benefits, maps the tools, and is honest about the pitfalls that stall most rollouts. It also covers what a working version looks like in 2026.
What self-service analytics means
Self-service analytics is a form of business intelligence where line-of-business professionals run their own queries and build their own reports, with minimal support from IT or the data team. That is Gartner's long-standing framing, and it captures the intent: move the querying from a central team to the person with the question.
It sits inside the broader goal of data democratization, which is making data usable by everyone who needs it. Self-service analytics is the operational layer that delivers that goal. Democratization is why. Self-service is how.
How self-service analytics works
A working self-service setup is a stack. Each layer has a job, and skipping one is where most failures begin.
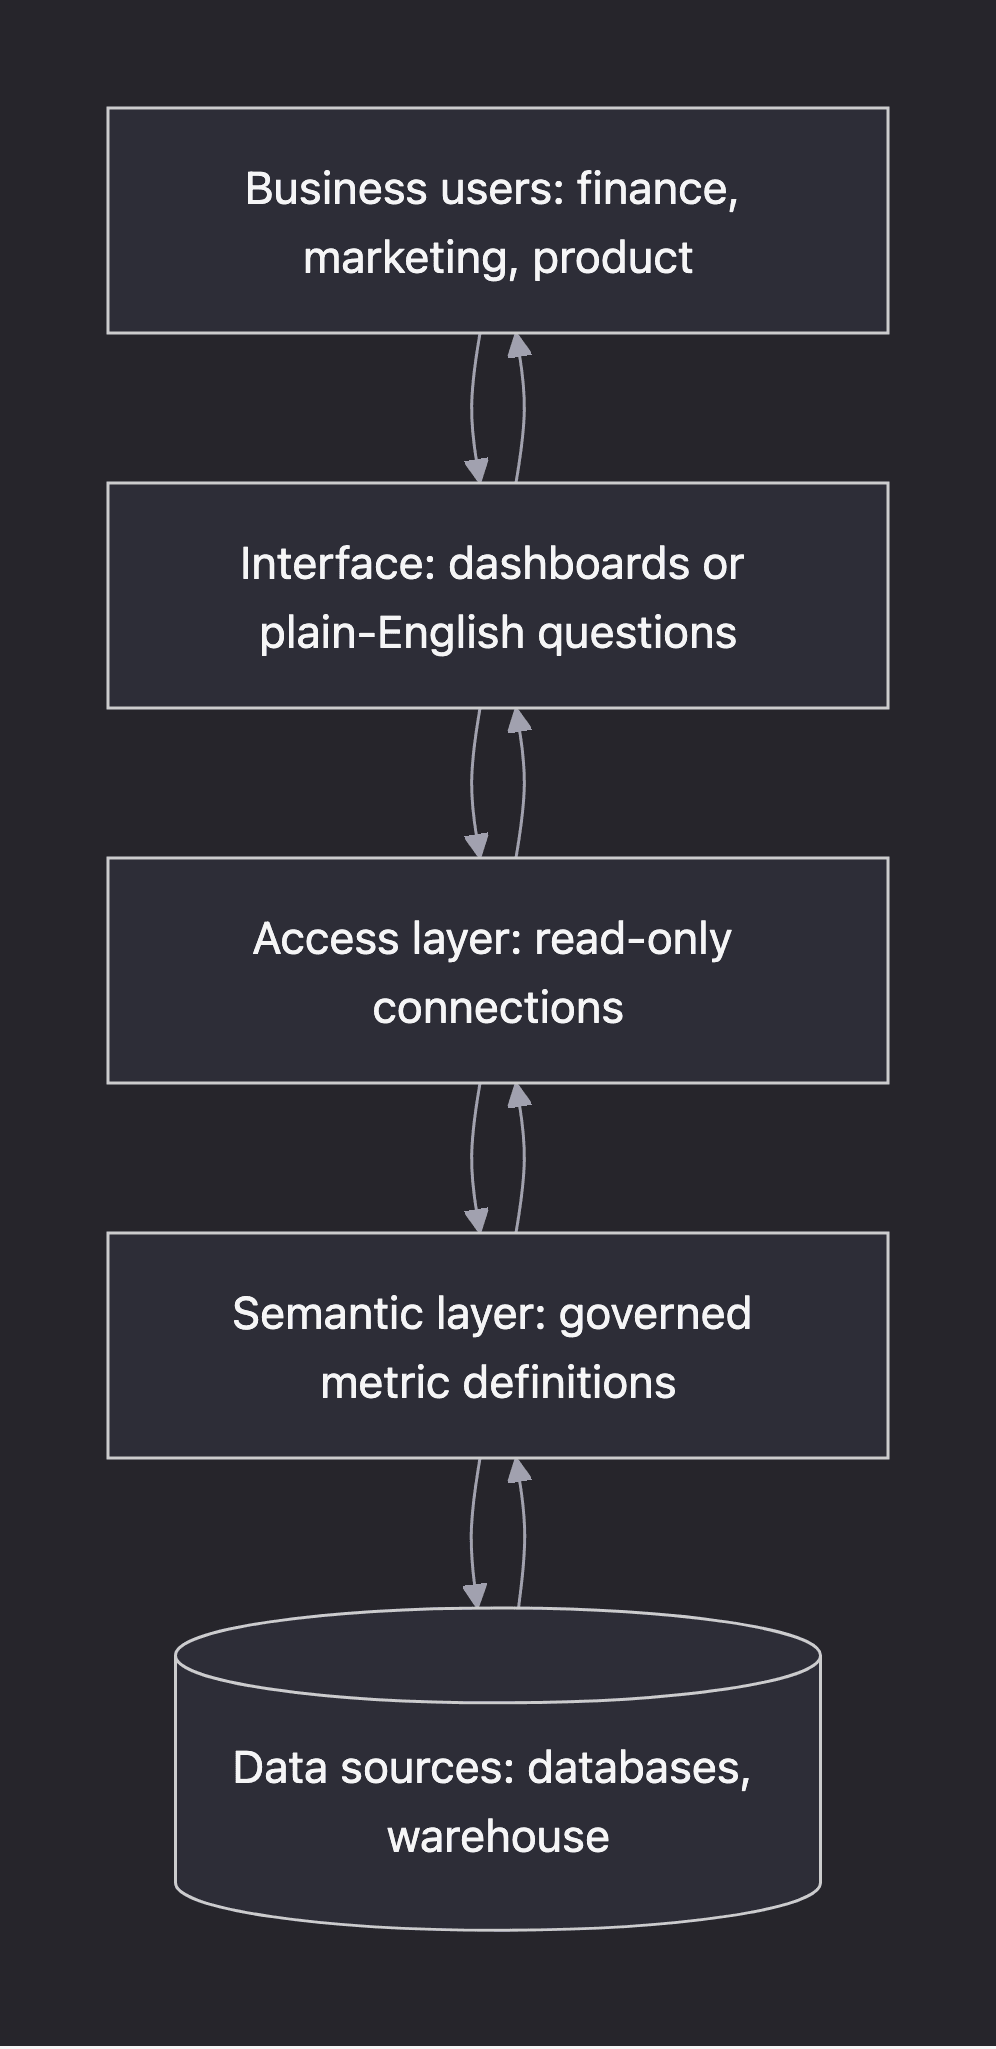
From the bottom up: data lives in your databases and warehouse. A semantic or metric layer defines what terms like "revenue" and "active user" mean, so answers stay consistent. A read-only access layer lets people query without changing anything. The interface is what they actually touch, either a dashboard builder or a plain-English question box.
The interface layer is where the old model and the new model split. Traditional self-service hands users a visual builder. The conversational approach lets them ask in words, then turns the question into SQL for them.
The four stages of self-service maturity
Most organizations move through a predictable progression. Knowing where you sit helps you see the next step, and the trap at each one.
| Stage | How people get answers | The catch |
|---|---|---|
| Centralized | Everything routes to the data team | Slow; the team becomes a queue |
| Dashboards | Pre-built reports for known metrics | Great for daily checks, weak for new questions |
| Self-service BI | Users build their own reports | High skill floor, low adoption |
| Conversational | Plain-English questions, governed | Needs governed metrics to stay accurate |
Most teams stall at stage three. They buy a self-service BI tool, expect adoption, and watch it flatline because building a report is still a technical skill. The jump to stage four is not a better builder. It is removing the build step, which we cover next.
The benefits, with numbers
Done well, self-service analytics pays off in three ways.
| Benefit | Evidence |
|---|---|
| Faster answers | Removes the 1-to-4-week request queue many teams report |
| Data team relief | dbt found practitioners spend most time on datasets, not reports |
| More confident decisions | Data-literate employees are 50% more likely to feel empowered |
| Measurable value | Top-third data literacy links to 3-5% higher enterprise value |
The data-team relief is the one leaders underrate. When a marketer answers their own question, an analyst is not pulled off deeper work to run a five-minute query. We quantify that drain in reduce your data team's ad-hoc request backlog.
The tools: two approaches
Self-service tools fall into two camps. They are not mutually exclusive, but they demand very different things from the user.
| Approach | What the user does | Skill needed |
|---|---|---|
| Traditional self-service BI | Builds dashboards and reports visually | Data modeling, sometimes SQL |
| Conversational / AI | Asks a plain-English question | None to start |
Traditional BI tools made reports easier to build, but building is still building. The user has to understand the data model and often the query logic. That ceiling is why adoption stalls.
The conversational approach lowers the floor. An AI data analyst reads your schema, writes the query, and returns a chart. For a side-by-side on when each fits, see AI data analyst vs BI tools, and for a tool-by-tool look, the best AI data analyst tools.
The pitfalls nobody warns you about
This is where most rollouts quietly die. Three pitfalls, and you should plan for all of them.
| Pitfall | What goes wrong |
|---|---|
| Low adoption | Non-technical users will not build their own reports |
| Metric chaos | Ungoverned access produces conflicting numbers |
| Literacy gap | People do not trust or correctly read the data |
Low adoption is the quiet killer. One practitioner described rolling out Metabase and waiting for users to engage: "it never happened." Asking someone to build a dashboard is asking them to become an analyst, and most decline.
Metric chaos comes from the opposite extreme. With no governed definitions, everyone invents their own. TDWI documented this as "spreadmarts" years ago, the personal data silos that wreck consistency. Two reports, two numbers, no trust.
The literacy gap underlies both. Qlik found only 24% of the workforce feel confident with data. A tool cannot grant understanding the user does not have.
What self-service done right looks like
The fix is to lower the skill floor and raise the guardrails at the same time. Plain-English questions handle the floor. Governance handles the guardrails.
- Let people ask in words. A conversational interface removes the build step that kills adoption.
- Govern the metrics. Define terms once so every answer agrees.
- Keep access read-only. People explore freely without risk. Use a read-only user.
- Show the query. Transparency lets people check and trust the answer.
This is not a new dashboard. It is a different contract: the user brings the question, the system brings the SQL, and governance keeps the answers consistent. We argue the broader case in why traditional data tools hold teams back.
The bottom line
Self-service analytics fails when it asks non-technical people to think like analysts, and works when it meets them at the question. Govern your definitions, keep access read-only, and let people ask in plain English. Want self-service that people actually use? Get started free or read the full data democratization guide.