
Only 26.5% of large companies say they have built a data-driven organization, and 91.9% blame culture, not technology, according to NewVantage Partners' 2022 executive survey. Every company wants its teams to make decisions with data. Almost none have made it actually happen.
The promise of data democratization is simple. Anyone who needs an answer can get it, without waiting on the data team. The reality is harder, and most attempts quietly fail. This guide explains what data democratization really means, why so many efforts stall, and how to give every team self-serve access that works and stays governed.
What data democratization actually means
Data democratization is making data accessible and usable to everyone who needs it, whatever their technical skill, with the right governance. A marketer should be able to answer "which campaigns drove paid signups" without learning SQL or filing a ticket.
People use it interchangeably with self-service analytics, but they are not the same thing. The distinction is worth getting right.
| Term | What it is |
|---|---|
| Data democratization | The goal: everyone who needs data can access and use it |
| Self-service analytics | The capability: the tools and access that deliver that goal |
Gartner frames self-service analytics as something deployed to "democratize data and relieve some of the burden placed on central data and analytics teams". Democratization is the destination. Self-service is the vehicle. We go deep on the vehicle in what self-service analytics is.
Why it matters: the bottleneck is real
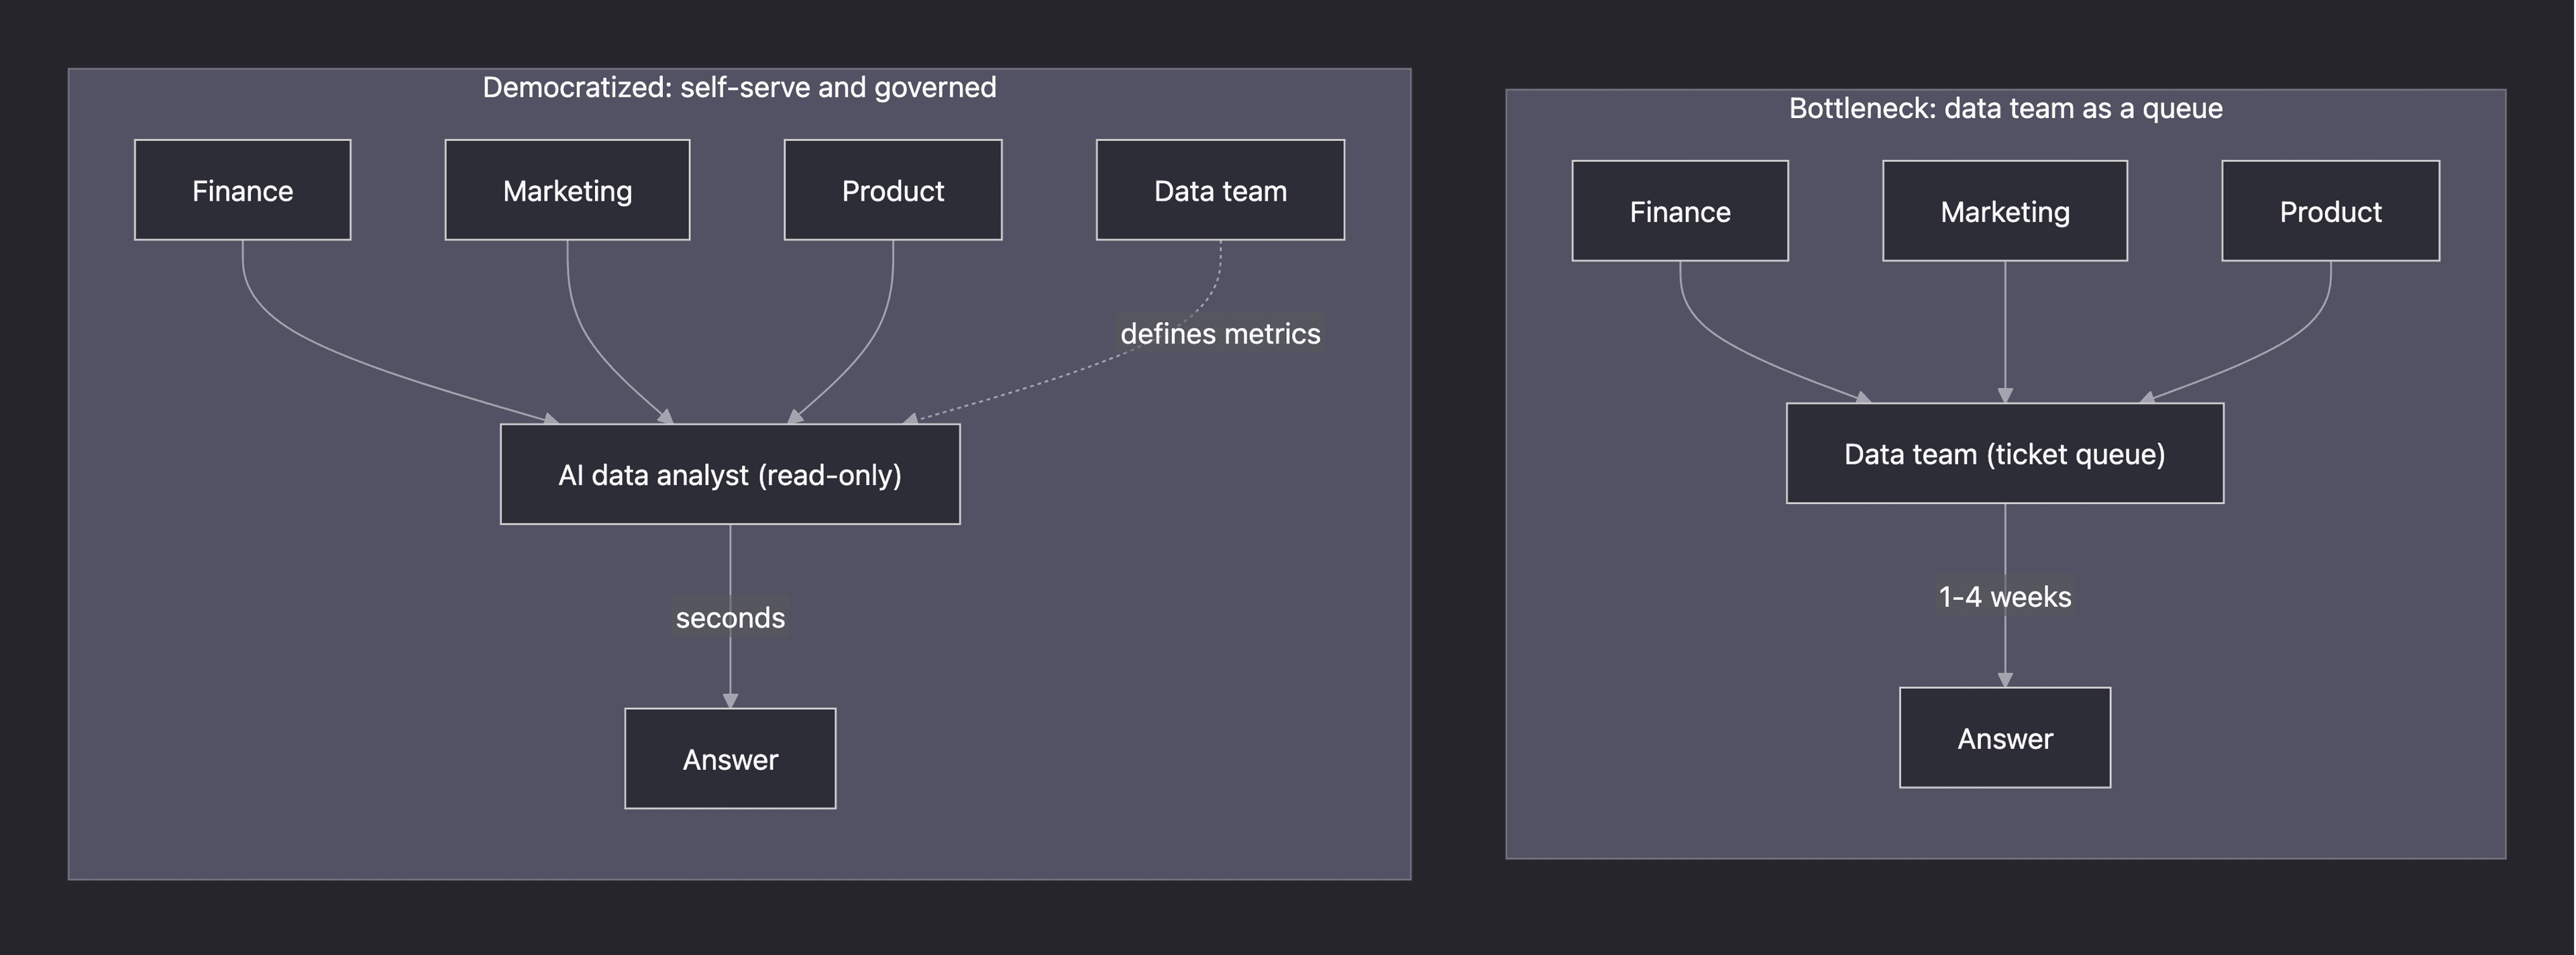
When data lives behind a small team, that team becomes a queue. And the queue is slow.
In a Sigma Computing survey, 55% of data experts said the average data request takes one to four weeks to turn around, and 76% spend up to half their time on ad-hoc reporting rather than higher-value work. The fieldwork was conducted in 2020, but the pattern holds. dbt Labs' 2025 State of Analytics Engineering found practitioners still spend most of their time maintaining and organizing datasets.
The cost lands on the business, not just the data team. In the same Sigma survey, 25% of business users said they had abandoned a question because the analysis took too long, and 20% admitted guessing on an important decision because the data was not ready. A bottleneck does not just slow answers. It kills questions.
Why most attempts fail
Here is the uncomfortable part. Buying a self-service tool rarely produces self-service. Three failure modes show up again and again, and you should design around all three.
People will not build their own reports
The most common failure is silence. You roll out a dashboard tool, and nobody uses it. One data lead described deploying Metabase and hoping users would engage: "it never happened, and it's probably never going to happen." Another put it bluntly: "Most people have absolutely no desire to learn anything, they just want their reports."
Asking a non-technical person to author a query or build a chart asks them to become an analyst. Most will not. They will escalate back to you instead.
Ungoverned access creates chaos
The opposite failure is too much access with too little structure. When everyone builds their own metrics, the numbers stop agreeing. This is an old problem. TDWI named it "spreadmarts" back in 2008, finding that over 90% of organizations had them, with analysts spending nearly two days a week maintaining personal data silos that strangle "any chance for information consistency."
Gartner sees the same tension today. Mandated self-service initiatives lead teams to "launch first, govern later", producing ungoverned pockets of self-service across business lines. Two people pull "active customers" and get two different numbers. Trust erodes.
Data literacy is the real constraint
Even with good tools and clean data, people struggle to use them. Accenture and Qlik found that 48% of employees defer to a gut feeling over data, and 74% feel overwhelmed working with it. Qlik's Data Literacy Index found only 24% of the workforce feel confident with data.
One data leader of 15 years was scathing about tools that ignore this, calling self-service dashboards and text-to-SQL "lipstick on a pig" that never solved "the root issue: lack of data understanding." That critique is fair, and any honest plan has to answer it.
The path that actually works
The fix is not a better dashboard. It is lowering the skill floor while raising the guardrails. People should ask questions the way they think, in plain language, against data that is governed and read-only.
This is where an AI data analyst changes the math. Instead of learning a tool, a person asks "what was revenue by plan last month," and the system reads the schema, writes the SQL, runs it, and answers. dbt's 2025 survey found around 65% of practitioners believe enabling non-technical users to create governed datasets would improve their data's value, and 29% already want natural-language AI querying but cannot offer it yet.
The plain-English interface addresses the adoption problem directly. We cover it in conversational analytics and the engine behind it in natural language to SQL.
How to give every team self-serve access
A workable rollout governs the definitions and the access, then lets people explore freely inside those guardrails. Five moves:
| Move | Why it matters |
|---|---|
| Democratize read access, not write | People explore safely; data stays protected |
| Use read-only connections | The AI can run SELECT, never change or delete data |
| Define metrics in one governed place | "Revenue" means one thing across teams |
| Offer a plain-English interface | Adoption stops depending on SQL skill |
| Keep a human in the loop | Consequential decisions still get reviewed |
Read access over write access is the cardinal rule. As one engineer summarized the consensus: "you democratize read-access and not write-access." Pair that with a read-only database user and you remove most of the risk. To bring this into the AI tools your teams already use, see how to query your database with AI using MCP.
Who gets unblocked
The biggest wins come from the people who used to wait. When they self-serve, the data team gets time back for the work only it can do.
| Team | A question they can now answer themselves |
|---|---|
| Finance | "What was net revenue by plan, month over month?" |
| Marketing | "Which campaigns drove signups that converted to paid?" |
| Customer success | "Which accounts dropped usage in the last 30 days?" |
| Product | "What is the funnel from signup to first query?" |
This is not the data team disappearing. It is the data team moving up. Freed from the ticket queue, they define the metrics, model the data, and handle the genuinely hard analysis. To stop the queue from forming in the first place, see how to reduce your data team's ad-hoc request backlog.
The shift is already how leading teams define their own success. In dbt Labs' 2024 survey, the single most common way analytics teams measured their impact was "enablement of other teams," cited by 42% of respondents. The job is no longer to answer every question. It is to make sure everyone else can.
How to measure whether it worked
Democratization is easy to declare and hard to verify. Track three numbers so you know it is real, not just announced.
| Metric | What it tells you |
|---|---|
| Self-serve adoption | Share of data questions answered without a ticket |
| Time to answer | How fast a routine question gets resolved |
| Metric consistency | Whether two teams get the same number for the same term |
Adoption is the one that exposes a failed rollout fastest. If access widened but the ticket queue did not shrink, people are not actually self-serving, and you have bought a tool nobody uses. Watch that number first.
Where this is heading
Data democratization stopped being a tooling problem and became a skill-floor problem. Lower the floor with plain-English access, keep the access read-only and the metrics governed, and the promise finally becomes real. Want to give your teams self-serve access on your own data? Get started free or see how Sequel works for teams.