
Instagram will happily tell you that you gained followers today. It is much less forthcoming about how many people left. That asymmetry is not an accident of the UI, it is baked into which metrics the platform surfaces by default, and it means a lot of accounts believe they are growing when the arithmetic says otherwise.
TL;DR
| Question | Answer |
|---|---|
| What does Instagram's follower graph show? | Gross follows gained, not net change |
| Where do unfollows live? | The follows_and_unfollows API metric, not the app |
| Why do most tools miss it? | The metric returns null unless you pass breakdown=follow_type |
| What does the breakdown return? | FOLLOWER = accounts that followed, NON_FOLLOWER = accounts that unfollowed |
| Real example, 30 days | 22 follows, 26 unfollows, net −4 on an account showing daily gains |
| Minimum requirements | Professional account, 100+ followers |
What is follower churn on Instagram?
Follower churn is the number of accounts that unfollow you in a period, including accounts that deactivate or get deleted. Instagram counts all of those as unfollows. Net follower growth is your gross follows minus that churn, and it is the only follower number that can actually go down.
The number you see is the wrong number
Pull the daily follower_count series from the Instagram API for a 30 day window and you get something that looks like steady progress. Here is a real account, mine, over 30 days:
| Day | New followers |
|---|---|
| Sep 14 | 0 |
| Sep 15 | 1 |
| Sep 16 | 2 |
| Sep 17 | 0 |
| Sep 19 | 3 |
| Sep 20 | 2 |
| Sep 21 | 2 |
Summed across the full 30 days, that series comes to 22. One to three new followers on most days, nothing alarming, a chart that slopes gently upward.
Now the same window through follows_and_unfollows, broken down by follow_type:
| Dimension | Value |
|---|---|
FOLLOWER (followed me) | 22 |
NON_FOLLOWER (unfollowed me) | 26 |
| Net | −4 |
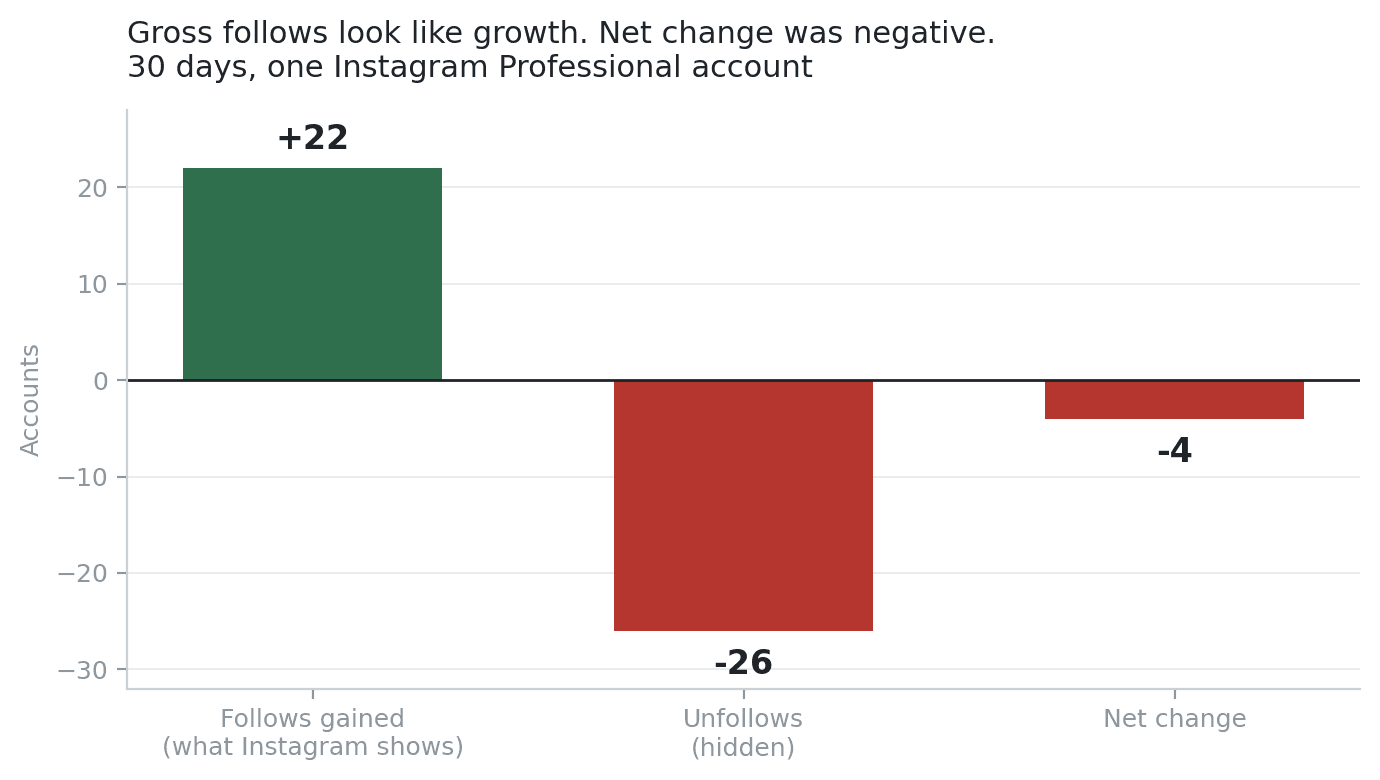
The account lost followers. The gross figure of 22 matches the follower_count sum exactly, which is the tell: follower_count is a gross metric wearing a growth metric's clothing. Every unfollow in that window is invisible to it.
Why most analytics tools do not show you this
Two reasons, one boring and one interesting.
The boring one is that follower_count is trivial to chart and follows_and_unfollows is not. The latter only returns data when you ask for it correctly.
The interesting one is that the metric fails silently when you get it wrong. Request it the obvious way and Instagram returns this:
{ "metric": "follows_and_unfollows", "period": "day", "value": null }No error. No hint. Just a null where a number should be. The metric requires a breakdown parameter, because the whole point is that the answer is two numbers rather than one:
metric=follows_and_unfollows
metric_type=total_value
breakdown=follow_type
period=day
Add the breakdown and you get the split. Leave it out and you get a null that is easy to mistake for "this account has no churn data". An integration built without reading the breakdown table will report the metric as broken, drop it, and ship a follower chart based on the gross number instead.
What a healthy and unhealthy split look like
Churn is not a failure state. Accounts deactivate, people lose interest, Instagram counts deleted accounts as unfollows. Every account bleeds some followers every month. The question is the ratio.
| Gross follows | Unfollows | Net | Read |
|---|---|---|---|
| 500 | 80 | +420 | Healthy acquisition, low churn |
| 500 | 430 | +70 | Reach is working, retention is not |
| 22 | 26 | −4 | Acquisition has stalled below the churn floor |
The middle row is the one worth dwelling on, because it is the case that looks best in a screenshot. An account adding 500 followers a month sounds like it is working. If 430 are leaving, the content is attracting the wrong audience, or attracting the right audience with the wrong promise.
There is a structural version of this too. A joint Metricool and HypeAuditor study of 700 million posts found that 93.5% of accounts post once a week or less, and that this cadence correlates with roughly 2% follower loss per year. Posting below a certain floor does not keep you flat, it slowly shrinks you, because churn continues whether you publish or not.
My own account is a clean demonstration: it had not posted since 20 August, and in the 30 days measured above it still took 26 unfollows while earning 22 follows. Nothing was wrong with the content. There simply was not any.
How to pull both numbers
If you have a Professional account with 100 or more followers, the follows_and_unfollows metric is available to you. Meta's own Instagram Account Insights reference documents both the breakdown requirement and the 100 follower floor. Connect Instagram to Sequel, using the Instagram to ChatGPT guide or the Claude Desktop guide, and you can ask for the split in plain English:
How many accounts followed and unfollowed me each month for the last six months? Give me a net column.The agent handles the breakdown parameter, so the null trap never reaches you. The same connection also exposes the metric that explains the churn, which is reach quality:
What share of my reach last month came from people who don't already follow me?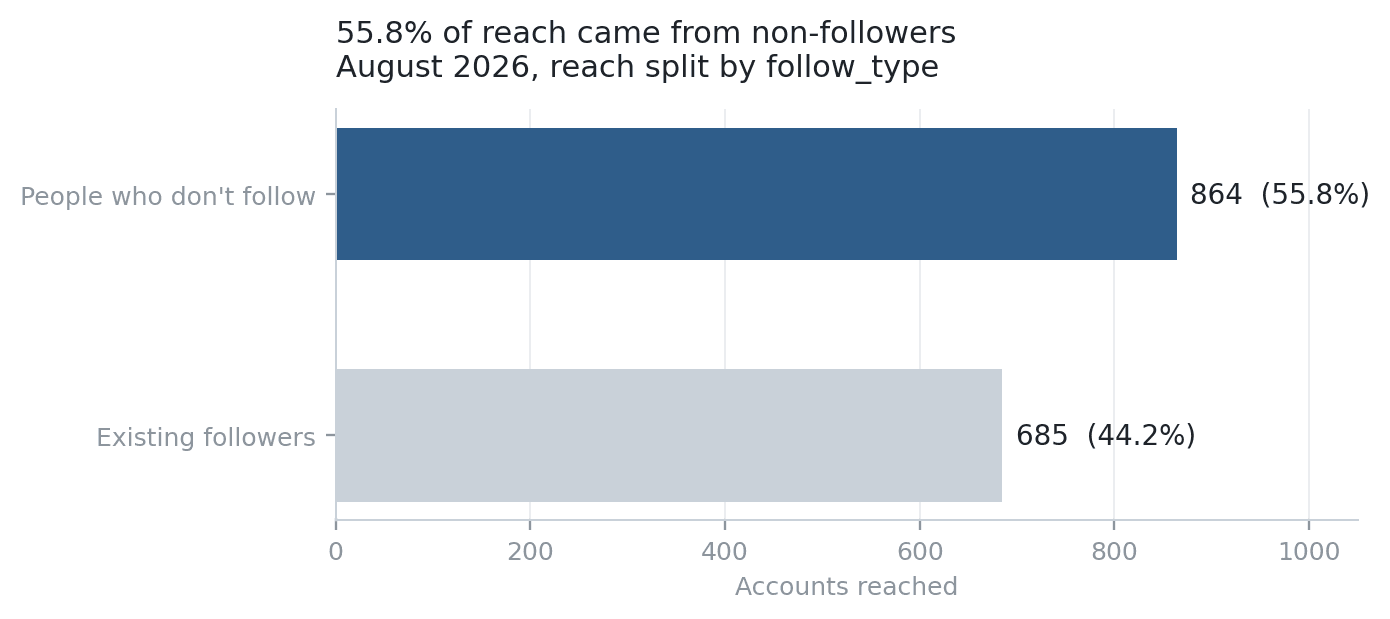
On the account above, 55.8% of August reach was non-followers, 864 accounts against 685 existing followers. That is a healthy discovery share. Plenty of new people were seeing the content. Not enough of them stayed, and the follower graph was never going to tell me that.
What to do with the answer
-
Trend net, never gross. If your reporting shows one follower number, make it follows minus unfollows. A gross chart cannot go down, which makes it useless as a signal.
-
Compare churn to reach, not to follower count. Rising unfollows alongside rising non-follower reach usually means your discovery content is promising something your main feed does not deliver.
-
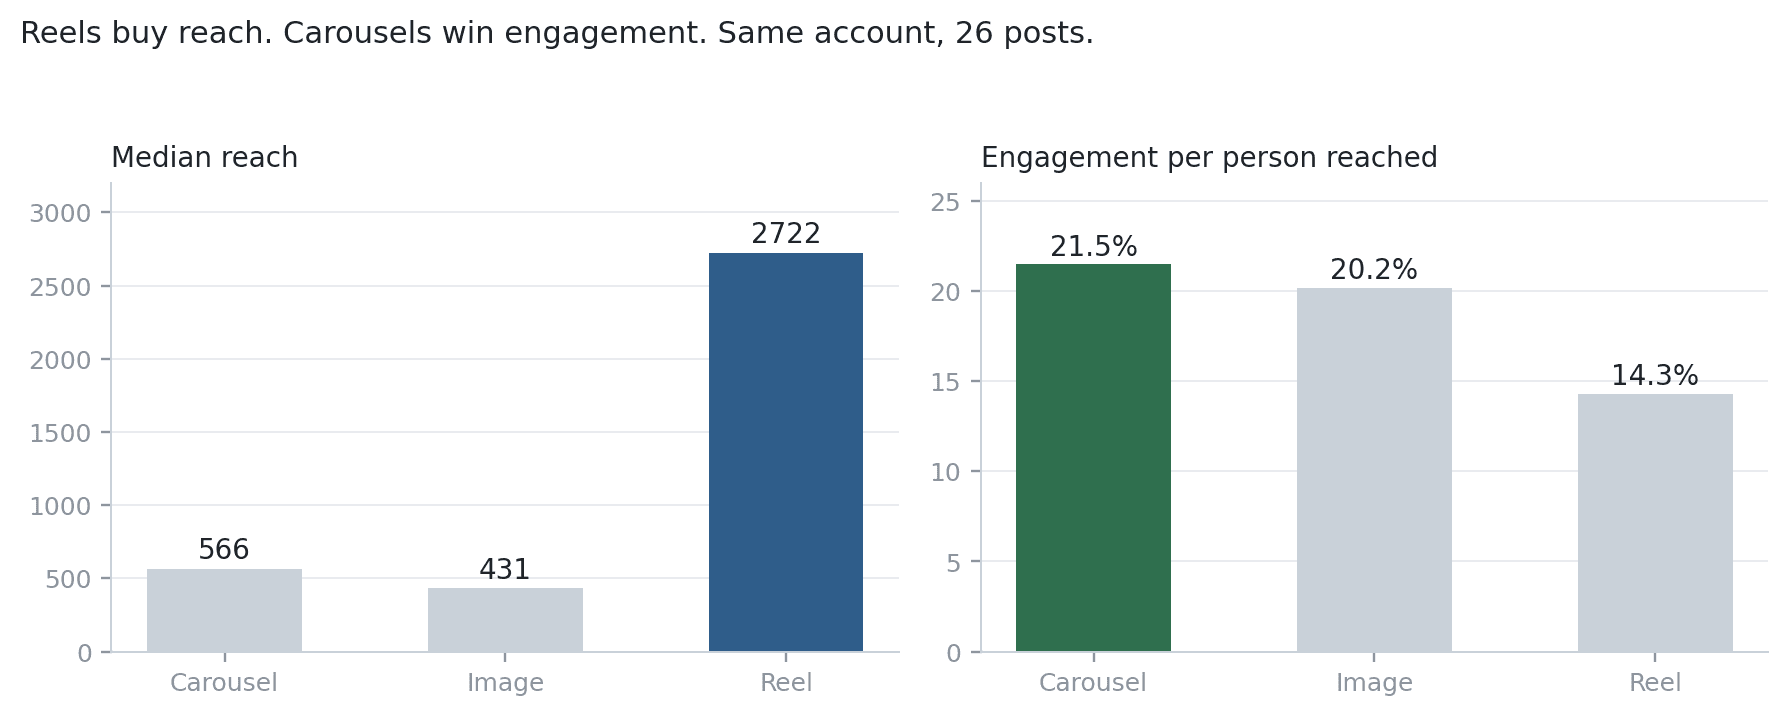
Check churn after a format change. A sudden reel push often buys reach and churn at the same time, because recommended content reaches people with no prior interest in you.
-
Accept a floor. Some churn is deactivations you cannot influence. Establish your own baseline over a few months rather than reacting to a single bad window.
Instagram is one source among several, and churn usually has a cause that lives somewhere else. If you want the same agent reading your site and product data alongside it, see how AI agents handle marketing analytics, what an AI data analyst actually does, and how MCP connects these tools together. For the wider landscape there is our roundup of the best marketing AI agents in 2026, and if you work in ChatGPT already, using ChatGPT for data analysis covers the general workflow.